The Database
The crowdsourcing application is currently in an alpha stage of development in which we continue to add features and services, especially pertaining to geolocation. We are also seeking ways to build a separate data visualization and mapping interface.
- For a full-page map interface, go here.
- For a tabular version of all data, go here.
- For recent contributions, go here.
- Visit our home page for more info.
We want your help! We are looking for coders and historians. Please add to the database and provide feedback. All data submitted to the ecocrisis database are reviewed and verified by members of the project team to ensure that the temporal, spatial, and descriptive attributes of the records meet the standards of the project and data model.
Event Types and Categories
We use a relational database management system (RDBMS) to collect and structure data related to health in Mexican history. SES events have been classified into fourteen different types which were then sorted into four categories, as shown below.
| category | type | description |
| climate | cold | Early frost or winter snowfall |
| climate | drought | Summer drought |
| climate | flooding | Flood events |
| climate | hot | Extreme summer heat |
| climate | storm | Storm with damaging winds |
| agriculture | biological | Insect infestations, plant disease or animal sickness |
| agriculture | scarcity | Scarcity of esential goods, especially food |
| social | conflict | Resource social conflicts |
| social | political | Administrative responses to ecological stress |
| social | religious | Religious responses to ecological stress |
| epidemiology | sickness | Human disease outbreak |
| other | abundance | Abundance of food and goods |
| other | other | Other natural event |
| other | tectonic | Earthquakes and volcanic eruptions |
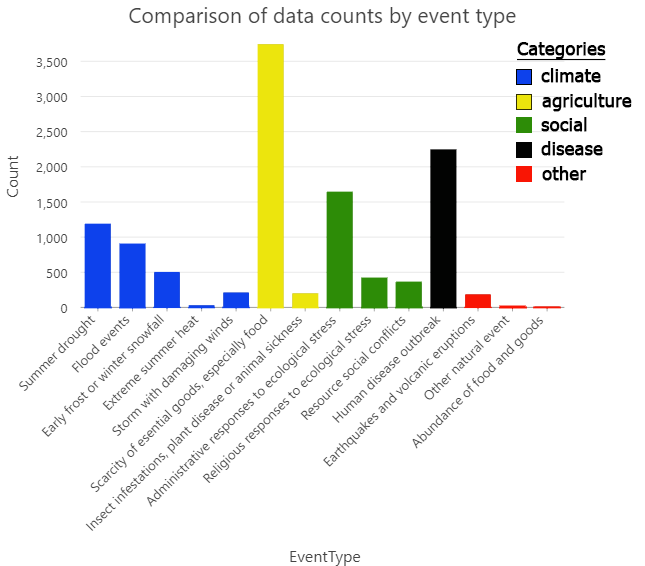
As seen in the chart below, a comparison of the counts of each type and category shows a rough equivalence across climatic (2,789), agricultural (3,921), social (2,393), and epidemiological (2,234) categories, with only a very small amount of events (190) in the 'other' category.
Sites and Distributions
Currently, there are about 630 unique geographic sites, 41 of which are not point locations, but geographic regions (such as the Valley of Mexico) which are labeled 'unspecified sites' in the database. In those instances, points were calculated to approximate the center of the region.
Some of the sites first reported as early as 1520, while others appeared only in the last decades of the colonial era. The following map shows the earliest reporting date for any particular date:
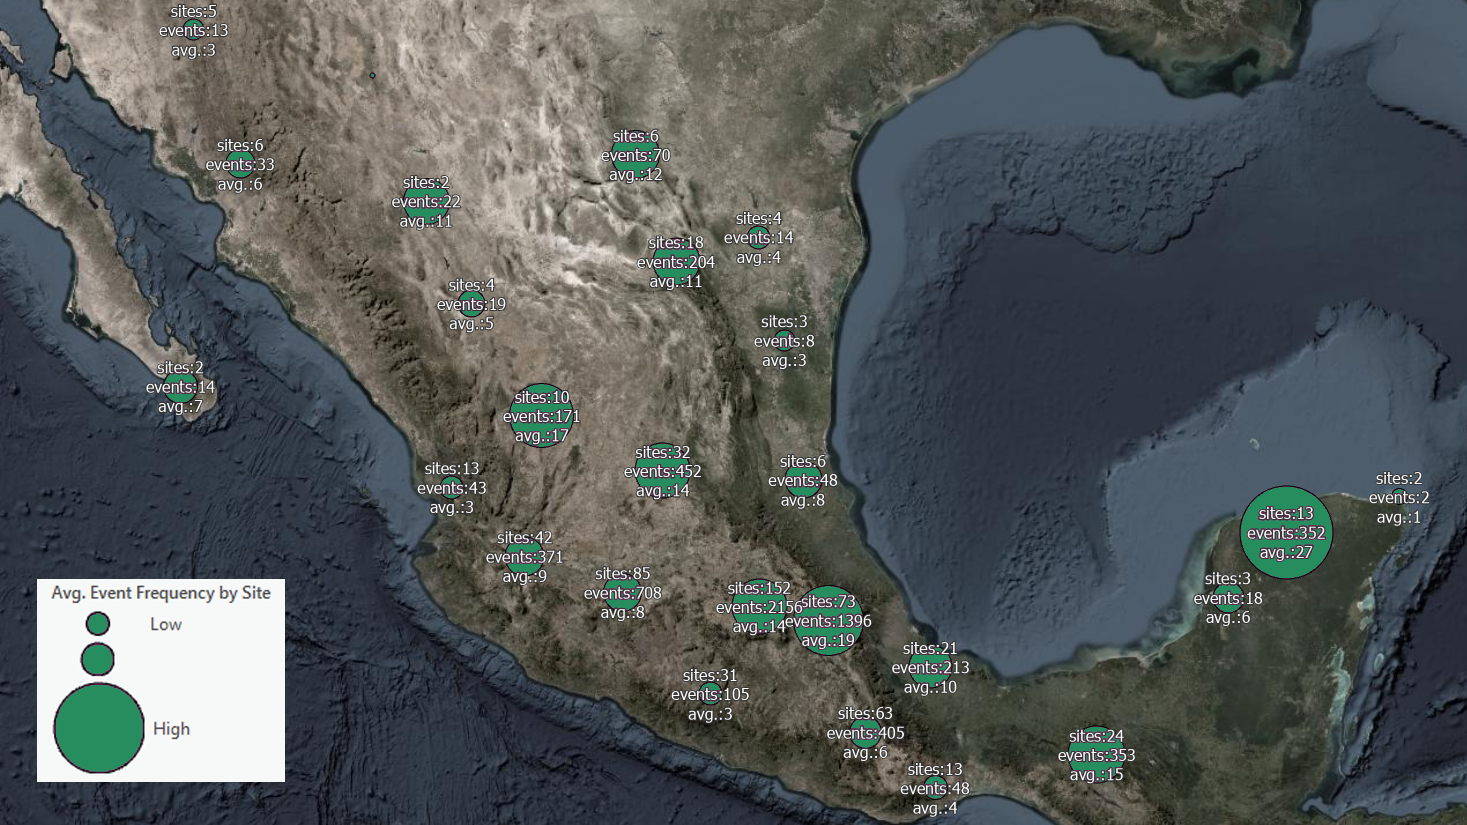
The map below aggregates events within modern municipalities. The map's timeslider (in the bottom-left corner) can be used to filter which events are being aggregated. Clicking on any municipality will open a popup with overall statistics. As new data is added through the crowdsourcing application, the symbology on the map (i.e. the color of the polygon) and the content in the popup will update automatically.
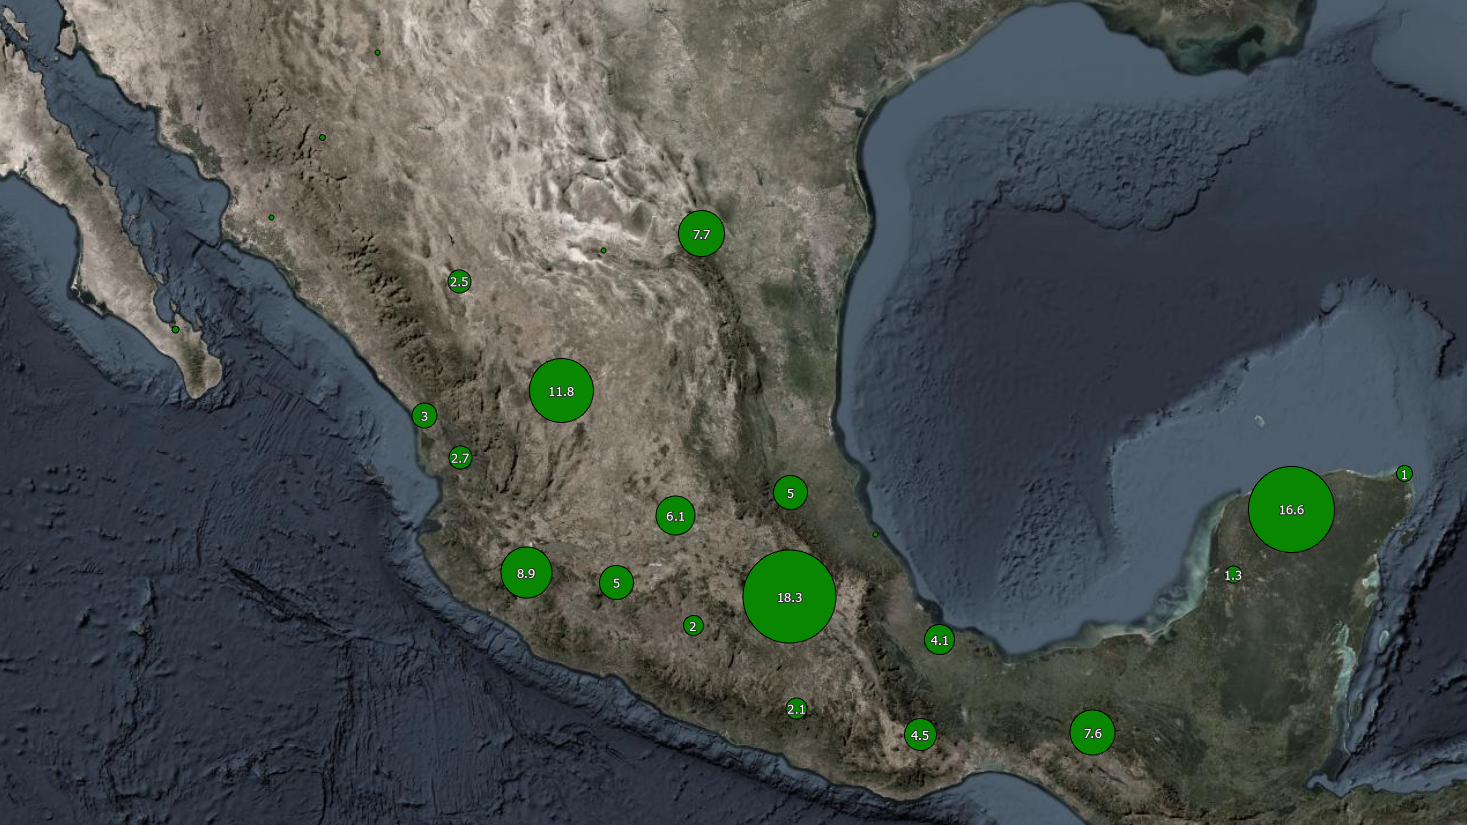
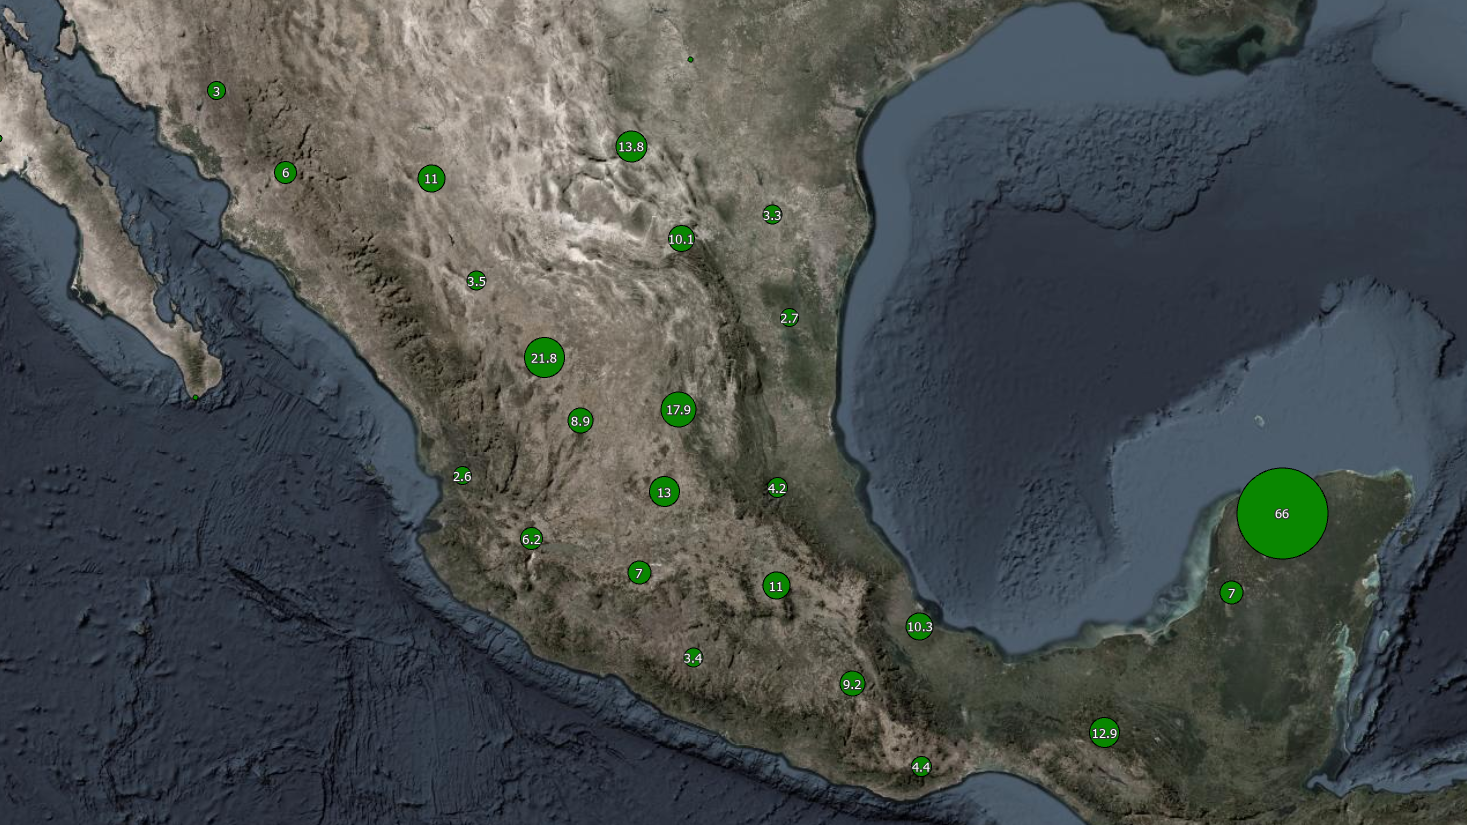
By the late colonial era, events are dispersed more evenly across Mexico. This is shown by comparing the event density of the first and last halves of the colonial era. In the early year, a few sites in and around Mexico City left a strong archival record. By the late colonial era, more and more sites reported consistently, even in northern Mexico, which rarely reported in the early colonial era.
Records
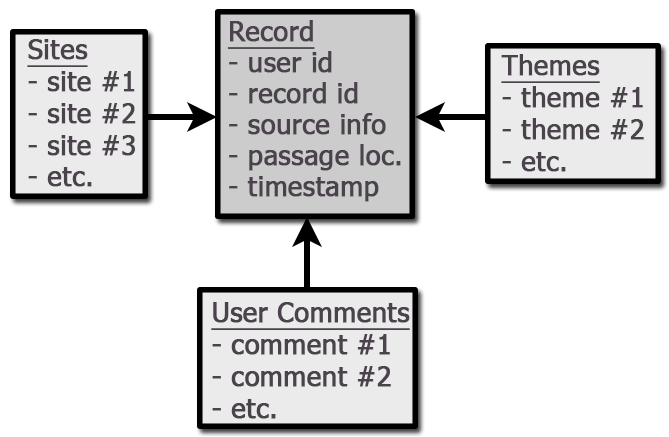
The data is modeled to prioritize historical and archaeological sources. As such, each record in the database must be associated with a single passage (or image) from a historical or archaeological source that can, moreover, be singularly dated (i.e. resolved to a single day, month, year, or decade, as determined by the temporal resolution of the source). This record is also associated with a single registered user (i.e contributor) of the ecocrisis project. The records are then associated with user comments (by those who submit the data or by those who wish to comment on another user's record), event types (i.e. themes) and geographic locations (i.e. sites). In fact, a record can have multiple places, multiple types of crisis events, and even multiple comments from multiple users. Currently, the database has about 3,200 records.
Themes
The database includes events related to:
- historical epidemics and mortality crises;
- scarcity and inaccessibility of essential goods;
- meteorological and climatic events;
- epizootics and animal infestations; and
- acts of civil disobedience, governance, law, and religion that can be related to demographic and ecological stress.
Currently, most records can be associated with one or more of the twelve prominent themes. The database has registered about two to three themes for each record, producing approximately 7,200 locatable events.
Geographic & Temporal Aggregation
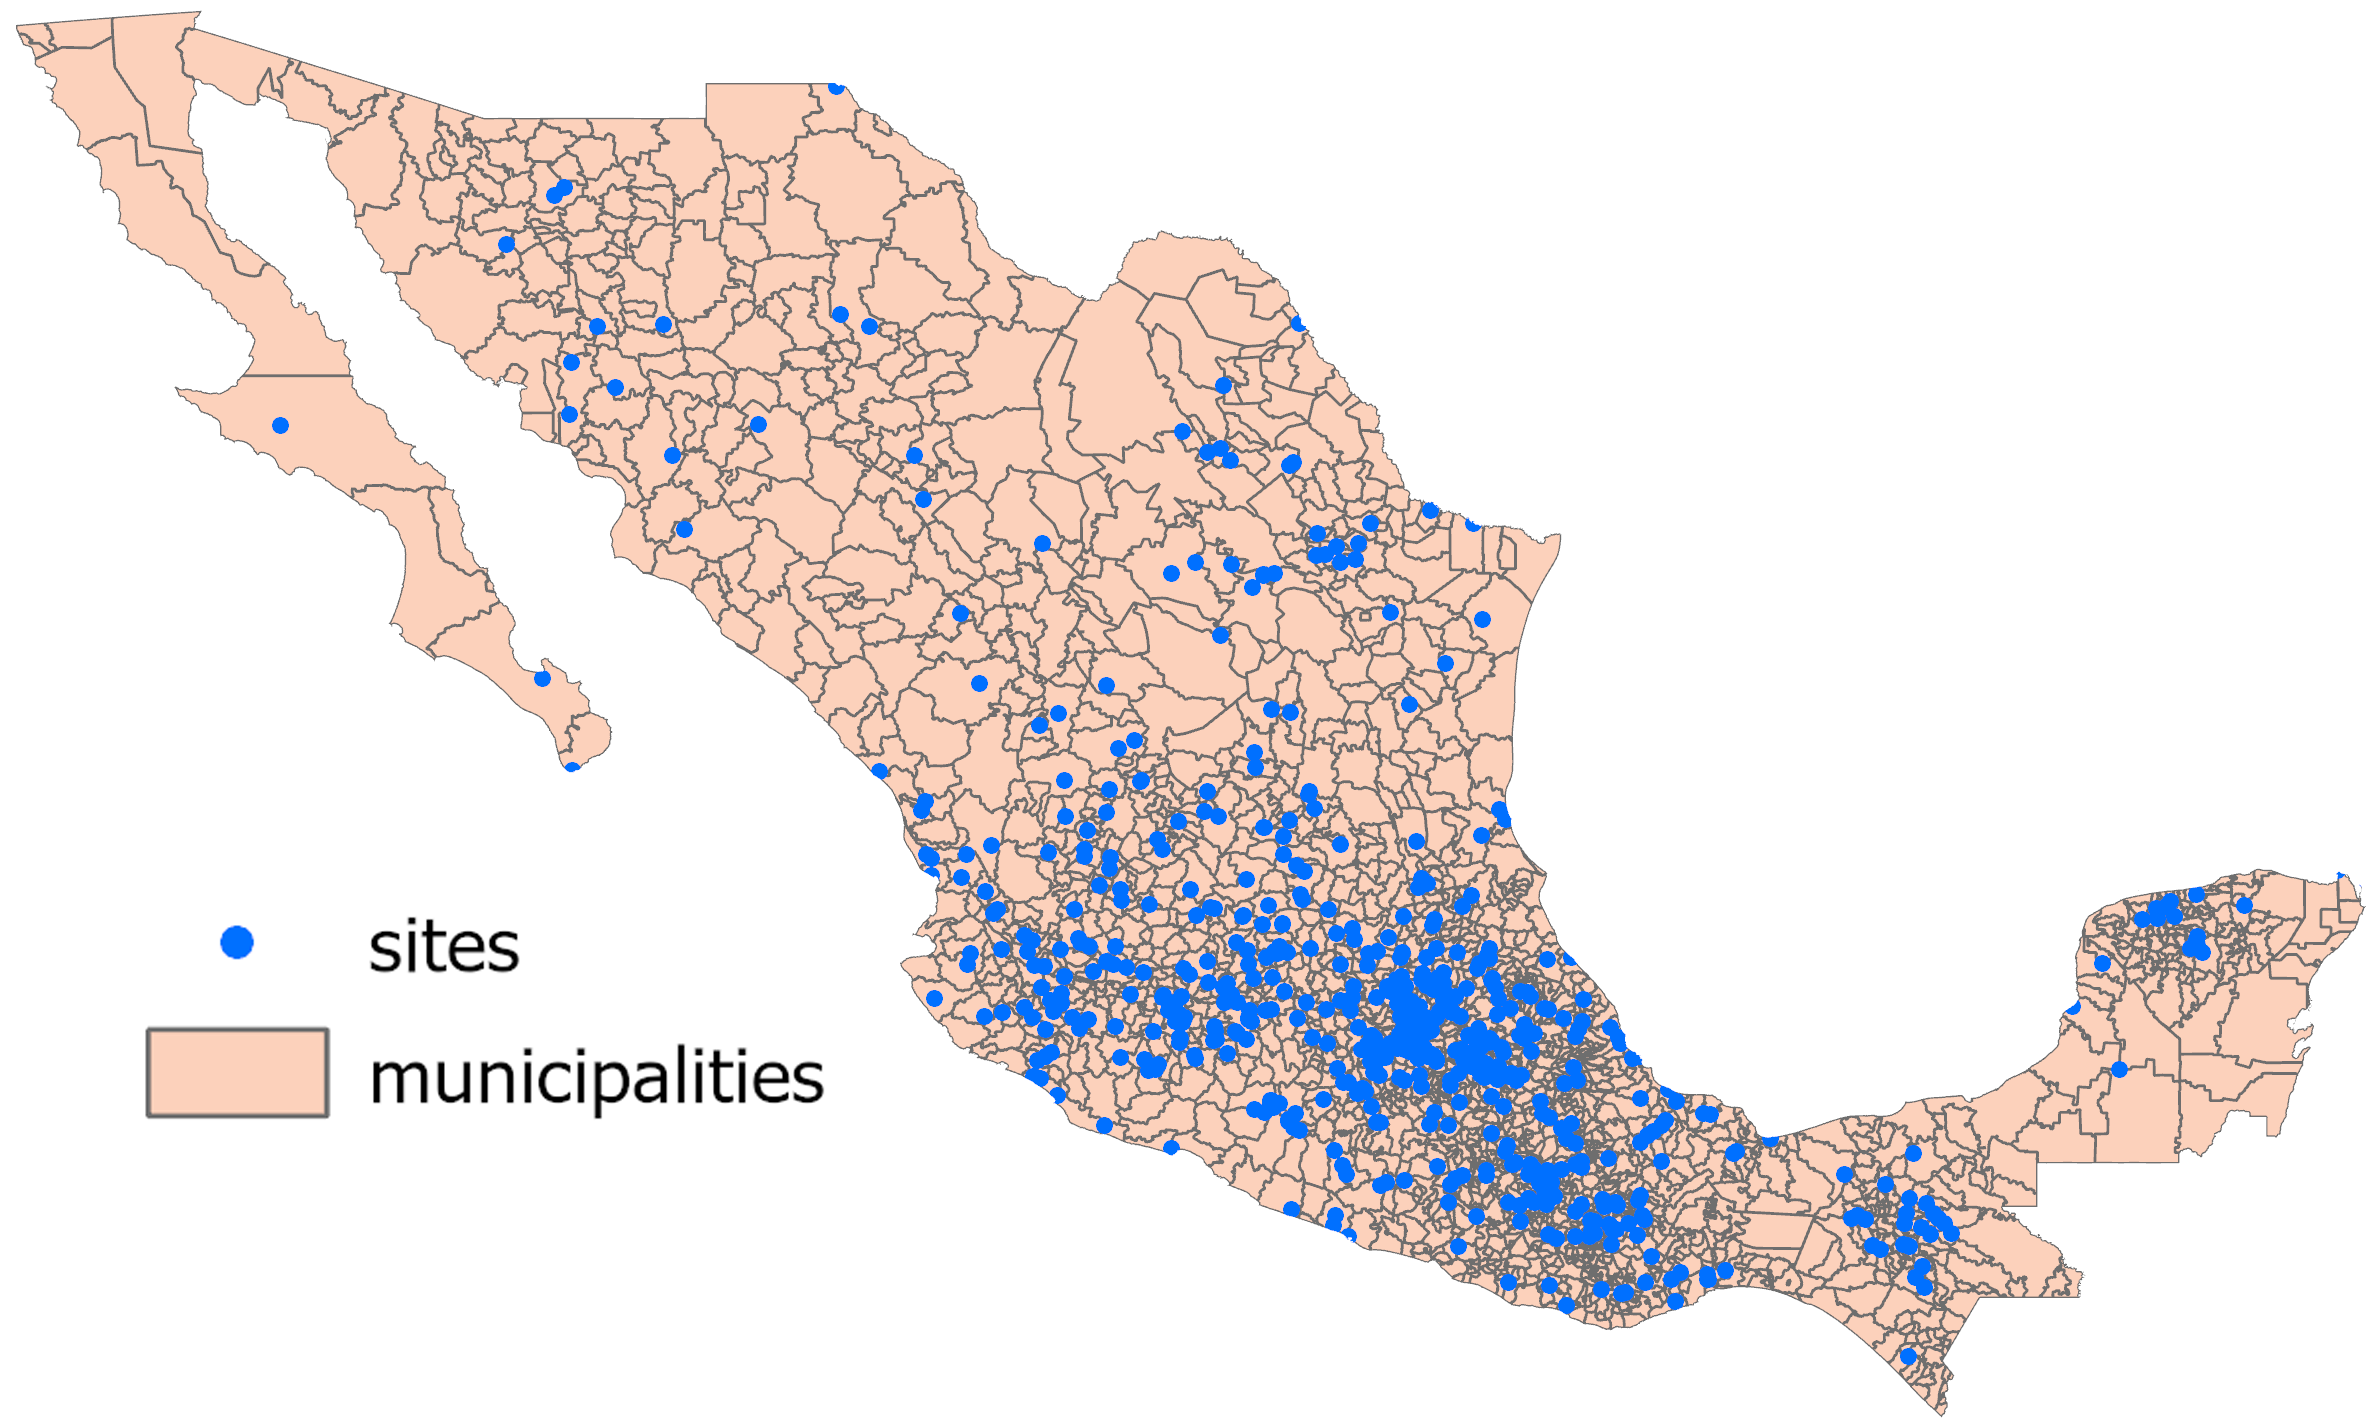
In many cases, records are best visualized when aggregated by both geographic and temporal bins. Geographically, one of the best aggregators is the administrative units of modern Mexican municipalities (numbering 2,469).
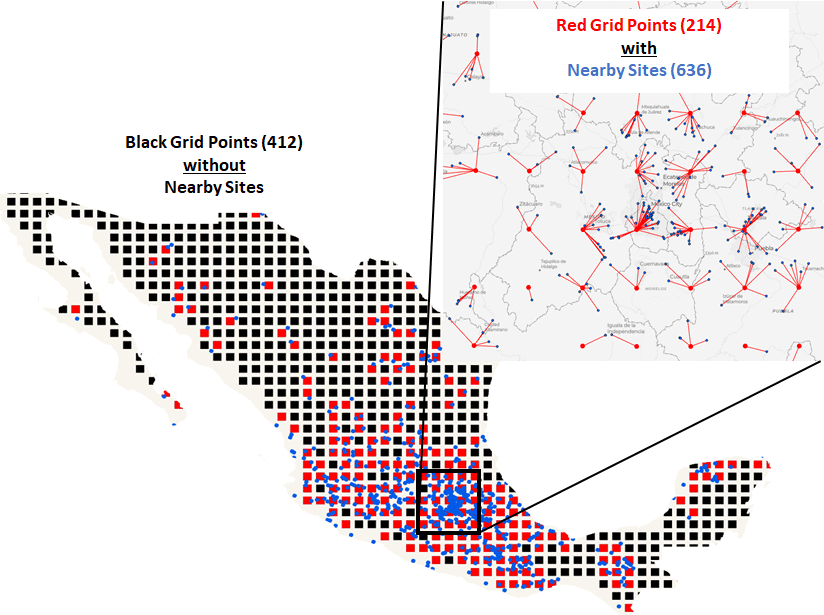
Alternatively, we can use a regularized set of grid points located every 0.5 degrees latitude and longitude. Currently, of the 412 grid points in Mexico, 214 have at least one site in their orbit.
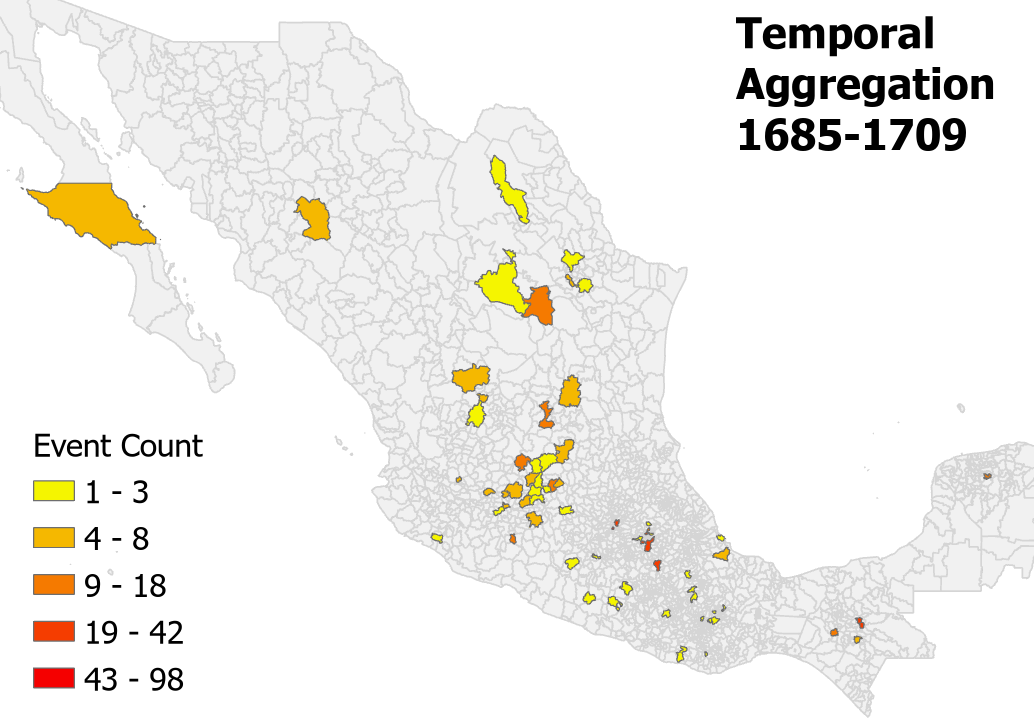
Temporal and thematic aggregation is also possible. The database is able to provide statistical summaries of events that meet any combination of user-defined thematic, geographic, and temporal parameters. These summaries can be visualized as statistics, as tabular data, or as maps.
