
Climate and New World Virgin Soil Epidemics: A Spatio-Temporal Approach to Understanding the Intersection of Mass Mortality, Spanish Imperialism, and the Little Ice Age in Early-Colonial Mexico
by Brad Skopyk
Draft paper prepared for the “Changing Climates – Changing Histories Symposium” at Dumbarton Oaks, October 21-22, 2022
Suggested citation
Skopyk, Bradley. "Climate and New World Virgin Soil Epidemics: A Spatio-Temporal Approach to Understanding the Intersection of Mass Mortality, Spanish Imperialism, and the Little Ice Age in Early-Colonial Mexico [draft paper]." Binghamton University Libraries, https://digitalprojects.binghamton.edu/s/ecocrisis/page/climate
Climate & Depopulation
Little debate remains about the extent and depth of American depopulation in the wake of European expansion from the 15th to 18th centuries. The population of even the largest, most militarized, and politically agile societies in the Americas, including those groups that allied with the invaders and thereby negotiated a far less coercive form of subjugation than neighboring polities, experienced a population collapse of at least 75% by the end of the first century of European control. This is equally true for the region of central Mexico, the focus of this essay and one of the most densely settled regions of the New World, if not the world. When a general census was carried out in 1643 by the Spanish colonial administration, probably only about 5-10% of the preconquest population remained [Gerhard: 22-28].
Until recently, historians have tended to associate mass mortality almost exclusively with the new diseases that arrived from the Old World and then spread to immunologically defenseless native populations. Before Alfred Crosby popularized the so-called 'virgin soil epidemic' paradigm in 1976, the theory had been gaining traction in public health bureaucracies of colonial states, such as Canada and the U.S.A. Beginning in the 1940s it was used to explain disease outbreaks in tropical island and Arctic communities that were experiencing a sudden wave of new imperialism.
In the last twenty years, however, scholars have pushed back against the VSE theory, challenging a narrative that had stripped imperialism of any real culpability in the decimation of American populations. Rather than downplaying immunological factors (i.e. the lack of acquired immunity amongst the native population), research highlights the many ways in which imperialism could shape mortality and fertility outcomes, a methodological approach that I call political-epidemiology. War and coercion, for instance, increased mortality rates during the onset and coping phases of the epidemics when families were torn apart through military recruitment, death, or acts of terror and pillaging. These approaches have focused mainly on the decades between epidemics, especially on the impoverished conditions of everyday colonial life. Hunger, infertility, hard labor, forced migration, and general cultural and social upheaval reduced birth rates and increased mortality rates, thereby complicating the apolitical lens of the VSE paradigm (see Alchon, Matallana Peláez, and Livi Bacci).
Despite the theoretical acuity of this new research, the interrogation of the material conditions of daily life under European rule has rarely moved beyond qualitative regional assessments. Research has not clarified the degree, locations, and time periods in which standard of living contributed to the suppression (or acceleration) of population regeneration, at least not for the time period before the late colonial era. Historian Amilcar Challú, for instance, has examined the variance of human height with access to food, focusing mainly on climatic and political factors in the late-eighteenth and nineteenth centuries. In this work, Challú documented significant biological stress in the last fifty years of the Spanish empire in Mexico [see his chapter "The Great Decline" in Living Standards in Latin American History]. Other historians have calculated real wages, either for Mexico as a whole or for major urban centers like Mexico City, to compare the standard of living in Mexico with that of other nations. This scholarship shows that the Mexican economy was roaring along throughout most of the colonial era. Per capita GDP reached a climax around 1710 and remained strong throughout the colonial era [Abad & van Zanden 2016], while buying power rose dramatically from 1580 until 1670, falling only after 1770 as conflict, demographic growth, and economic reforms took hold [Abad, Davies & van Zanden 2011]. Throughout much of the eighteenth century, real wages were actually higher in Mexico City than in Madrid [Abad & van Zanden 2016: 1999]. The rise of real wages in Mexico had an inverse relationship with population trends. Real wages rose when population fell, a pattern accentuated in times of demographic collapse. When Mexico experienced sustained growth in real wages and per capita GDP for more than a century after the early-colonial pandemics, it followed a well-trodden path to recovery, not so different from the demography of London, England, after the Black Death.
This paper adds to this exploration of the relationship between population growth and standard of living. It does so by bringing together and correlating two datasets, the first of which derives from historical archives and collects geolocated event data about social-ecological stress experienced in historical human communities (i.e. the SES dataset), and the second corresponds to historical soil moisture conditions (self-calibrating Palmer Drought Severity Index available through the Mexican Drought Atlas, referred to as scPDSI) as gleaned from Mexican tree rings and fitted to a regularized grid of points located at half-degree intervals, wherein each point possesses its own customized index to represent 'normal' and 'anomalous' soil moisture conditions as compared to local normals. The two databases overlap temporally for the period between 1518 and 1820 and geographically across nearly the entire area of Mexico, although we will see that the density and temporal coverage of SES events is less well developed for northern Mexico.
The SES data derives from a larger, ongoing project (The Ecology of Crisis) to collect and geolocate pre-twentieth-century historical and archaeological evidence related to biological stress and mortality in human populations and in the ecological systems that sustain them. The SES data are classified into fourteen types of phenomena which can be further sorted into epidemiological, climatic, agricultural, and social factors. The types and categories are described in more detail in the ecocrisis Database page. The rationale of the larger project is that knowledge of the timing, location, severity and ecological contexts of historical mass mortality events will permit and encourage a rethinking of health outcomes in the age before modern medicine. Moreover, geolocation enables data to be compared with other geolocated datasets, such as with historical demography datasets, imperial policy datasets, or those of the Mexican Drought Atlas. To this end, the project leaders hope that the ecocrisis database will allow scholars to assess how government policy and practices contributed to mass mortality; how climate change initiated or drove mortality; or how food system economics might help to explain mortality events.
This analysis provides a strong statistical basis for identifying where, when and the degree to which severe weather associated with early-modern climate change during the Spanish colonial era changed the standard of living in Mexico and thereby impacted the health outcomes for those who lived there. This is especially true for individuals and groups who had limited access to basic resources under Spanish imperial rule. Anomalous climate conditions had repercussions at two different spatial scales. On the one hand, climate drove generalized regional suffering. This is demonstrated by a rising frequency of SES reporting from a larger than normal set of sites dispersed across the reporting region. As the climate normalized, reports of ill health, hunger, crop failures, and social crises also waned. Even more telling, however, is the second type of spatial pattern that emerged during these crises. The location of sites with reports of agrarian and food crises were associated with more severe climatic stress than for non-reporting sites. In any particular year, reporting sites had scPDSI values that were 10-30% more severe than non-proximous scPDSI values. Simply put, human suffering increased with proximity to climate hotspots. Because the kinds of SES reports that were analyzed in this research pertain to food production, access to food, and social upheaval related to health ('social upheaval' relates mainly to food riots and public policies related to food regulation, tribute & taxation, and policing of the social order), it is fair to say that the analysis demonstrates the important role of climate change in determining the state of public health and, by extension, the standard of living.
Climate also left its mark on population regeneration, which slowed (1545-1670), accelerated (1670-1770), and slowed again (1770-1820) during mostly-parallel climate phases. Admittedly, this correlation between rates of population regeneration and climate severity will eventually require a fuller aggregation of population statistics. The current study uses piecemeal evidence rather than holistically-compiled evidence, while also relying upon some general resources, such as Peter Gerhard's classic work and numbers derived from Our World in Data. Even with this meager evidence, the correlation between these two entities appears to be strong; as climate worsened, population regeneration slowed, and vice versa. A discussion of this correlation is offered in the Demography section below. In broad terms, this chronology mirrors the best reconstructions of the global climate during this era. The climate between 1570 and 1720 formed part of a global phenomenon with a peak between 1590 and 1670 [Neukom et al. 2014]. It is likely that Mexico's population regeneration was mired in this climatic era.
The final part of this paper will discuss the repercussions of my arguments for the virgin-soil and political-epidemiological paradigms. To synthesize, I would say that my research should provide a critical context for the interpretation of health, neither displacing nor undermining previous explanations, but emphasizing the significance of climate as a factor in the patterns of life and death in colonial Mexico.
The SES Database
The Social-Ecological Stress database is the centerpiece of the Ecology of Crisis project, collecting information about health and ecology in Mexico before the 20th century. Data is being actively collected from members of the project team, and will be expanded to other scholars by the end of 2022 when the crowdsourcing application is ready. The expectation is that the database will expand rapidly in 2023 and for the next three to five years. Plans are also in place to build a sophisticated visualization interface that will allow users to analyze and compare the SES data with climatic and demographic variables. All data submitted to the ecocrisis database are reviewed and verified by members of the project team to ensure that the temporal, spatial, and descriptive attributes of the records meet the standards of the project and data model.
The primary record in the database is the historical or archaeological source, usually a passage from a primary document, but sometimes taking the from of an image from a historical document or from an artifact, or even a dataset. Most sources in the database have a provenance as administrative records that were archived by towns or provincial governments. Others derive from narrative sources such as local histories, religious visitations, or geographic descriptions. At present, only a small number of sources come from litigation, although this is clearly where the database can be expanded in the future. In all cases, the original text, imagery, or dataset is entered into the record, making the database a rich historical catalog of events.
Currently the database contains about 3,800 unique records (i.e. unique passages), each with an average of about three iterations, either as multiple themes or multiple places. The maximum count of themes and sites for a source is 7 and 22, although the average number per source is actually 1.8 and 1.2, respectively. In many cases, unique 'sources' represent unique passages rather than actually unique volumes. For example, local indigenous annales are a rich source of data about health and ecology in Mexico. On page 410 of the Anales de Tecamachalco y Quecholac, for instance, we find the following:
Fue nombrado guardián fray Diego de Estremera, gobernador don Felipe Xuárez, alcaldes don Juan de Ojeda, don Baltazar Marmolejo. Don Pedro Elías concluyó el año de gobernador cuyo cargo lo tenía don Felipe Xuárez […] En este mismo año una muy gran peste vino a aparecerse sacrificando a multitud de víctimas haciéndoles arrojar sangre por boca y narices y por la parte inferior: llegó en el mes de mayo en tiempo de siembras, llevándose diariamente 10, 15, 20, 30, 40. De los niños murieron muchísimos, y de los grandes caballeros un sinnúmero. Duró esta peste maligna un año completo.
The passage is dated as 1545-05 (yyyy-mm), located in the towns (altepeme) of Tecamachalco and Quecholac, and is classified as 'human disease outbreak'. Other sources have a less specific location such as the 'Valley of Mexico', a non-administrative areal unit. In its current iteration, such areas are rendered as a single point at its geographic center. In the coming months, however, such locations will be rendered as the principal towns of each intersecting municipality. This will produce a more accurate representation of the geographic distribution of the event. For the Valley of Mexico, this associates the passage with sixty unique points, one for each municipality within the Valley of Mexico.
This is likely the moment to consider the implications of this type of reductive approach to the sources whereby a rich historical passage is synthesized into a simple coded entity, a series of x/y coordinates, four or seven character dates, a short event-type code. Many historians would see this method as dehumanizing of the archival record. I would argue, however, that my approach allows us to contextualize the passages in ways that a close reading cannot accomplish on its own. Each data point is a remembrance of a shared experience, a shared trauma. I would recall Franco Moretti's defense of the distant reading approach in Graphs, Maps, Trees or, closer to my field, William Taylor's call for a 'synoptic reading of history' that challenges historians to look far and close, both in time and space. "A key to imagining colonial territories in the future Mexico," Taylor posits, thinking of Louis O. Mink's famous essays, "is to keep larger and smaller in mind at the same time, to cultivate a more synoptic historical practice" [Taylor, Shrines and Miraculous Images]. I believe that my attempt to analyze the statistical contours of life and death in Mexico through modern computational methods will make my return to close reading of these and other sources a more meaningful endeavor.
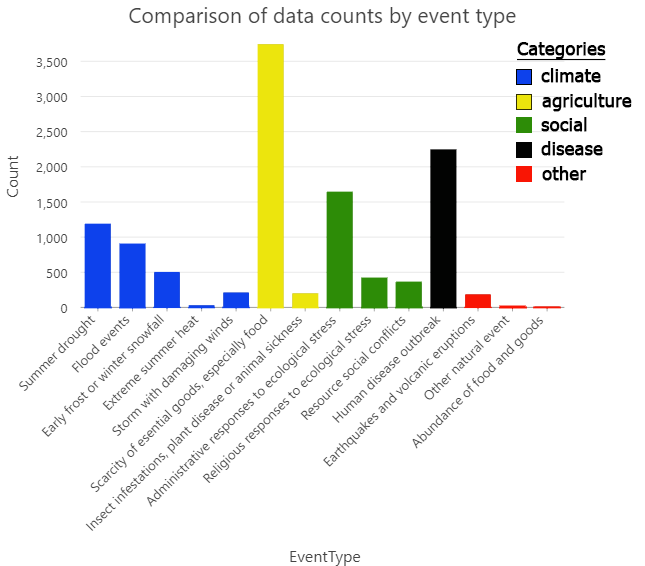
Once a source is entered into the database with specific temporal parameters, contributor information, and record timestamp, the user associates it with one or more themes (i.e. event types), geographical locations, or user comments. The database schema is discussed in further detail here. By adding locations and themes, the historical source becomes more than a simple list item; it is now a geolocated database that can be mapped, queried, and filtered by place and type. Currently, fourteen distinct themes are available as event types that sort into four categories (climatic, agricultural, social, and epidemiological), each with roughly an equal number of entries. A fifth category of 'other' includes themes that are poorly correlated health.
As seen below, the predominance of "scarcity" events stands out, essentially doubling that of the second and third most important themes (disease outbreaks and administrative responses, respectively). This is not surprising given the centrality of the food production system to the maintenance of political power, especially in the early modern world.
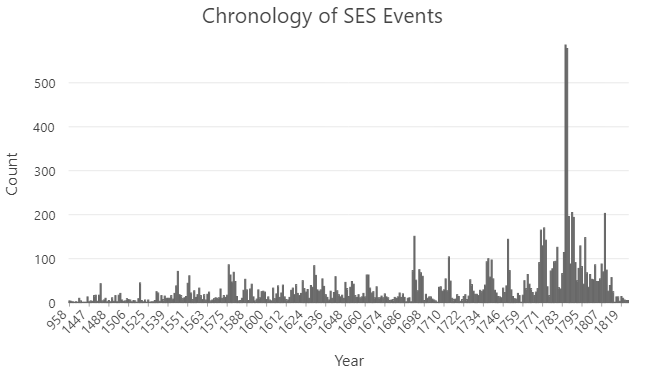
As the chart below makes clear, the annual count of SES events increases during the colonial era, again in the eighteenth century, and once again around 1770. This surge in reporting is mostly an indication of the availability of documentation in the later colonial era (because more was written and more was preserved), rather than of a trend worsening conditions. Nevertheless, peaks within the various reporting epochs do indicate severe social-ecological stress.
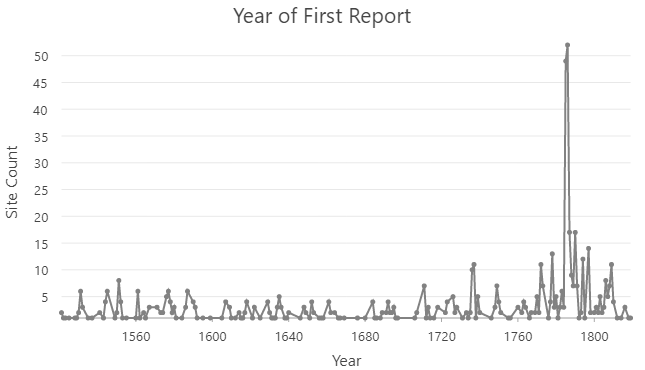
In contrast to the total number of events reported, which rose in stages, the number of new reporting sites (shown in the chart below) remained essentially unchanged throughout the colonial era. On average, the database adds 2 or 3 new sites each year until 1784. Then, in 1785 and 1786, more than one hundred new sites appear in the database! Not surprisingly, these two years (known as the year of hunger) had the most severe weather in Mexico over last 650 years and resulted in widespread famine. By the 1790s, that number had dropped again to 3 new sites per year. The density and reporting habits of the sites in the database can also be explored cartographically with two interactive maps provided in the Sites and Distributions section within the Database page. The second of those maps allows users to view the year-by-year chronology of events at particular sites. The maps reveal that very few sites in Mexico's north appear in the database in the first century of colonial rule and that the dominant region of reporting sites was the Valley of Mexico and surrounding areas. Nevertheless, sites in the Yucatan, Chiapas, Oaxaca, Michoacan, and Jalisco--all distant from Mexico City--have excellent representation in the database.
As we have seen, the SES records are not continuous through time and certainly not through space. This is a crucial point with important methodological and interpretive consequences. Such discrete values do not offer any possibility for interpolation between reporting sites or between reporting dates. In other words, because SES reporting is episodic and crisis driven, and because we must assume that many reports have been lost (or not yet found), the database does not (and cannot) tell us about normal conditions. Null values in the SES database (i.e. years where a site is not reporting) cannot be assumed to be normal, even though many such null values may, in fact, have been crisis free. Similarly, good years (i.e. years of abundant--but not excessive--rainfall, or of warm harvest seasons, or of early spring rainfall, or other such propitious events) do not appear in the database. Of the more than 11,000 events in the database, only one mentions abundant harvests! We know that some null values will be years of abundance and good health, but we cannot predict which of the null values would have those values, which might be normal, and which might be years of crisis that alluded reporting or detection in the database. In the future, the database might be more complete and thus reliable or other dataset might be integrated (such as price indices of basic goods have been used in the past to reconstruct agriculture conditions, from poor to normal to good), but currently this data has not been aggregated and geolocated. Consequently, my research methodology treats the SES data as discrete records that can be compared with continuous datasets, but not formally correlated through geostatistical means.
The Mexican Drought Atlas
The growth of certain tree species in Mexico is highly sensitive to soil moisture conditions in the summer growing season, especially from June to August. For all but the most northern regions of Mexico, there are just eight different tree-ring chronologies reaching back to 1500 C.E., sixteen for the seventeenth century, and twenty-four for the eighteenth century. The same three tree species dominate these chronologies: Pinus hartwegii, Pseudotsuga menziesii, and Taxodium mucronatum.
A recent paleoclimatological tool called the Mexican Drought Atlas—devised by dendrochronologist David Stahle and associates—employs a complex methodology to merge these multiple data sets and to construct a separate chronology for each point within a grid of 1501 points, 651 of which are located in the modern republic of Mexico, dispersed evenly at 0.5 degrees latitude and longitude. Soil moisture conditions are calculated at each of these 1501 points and are expressed as variances from the site-specific mean. The MXDA calculates PDSI for each year for each grid point. PDSI values estimate the variability of soil moisture conditions, calculated at each of the grid points. In this case, grid points receive a value for each year that falls between –4 (extreme drought) and +4 (extreme wetness), depending on the growth of the trees that belong to the multi-member weighted ensemble of tree rings that is defined for each point. This site-specific index is known as the self-calibrating Palmer Drought Severity Index (scPDSI, herein referred to as PDSI), a standard tool to measure drought. The MXDA correlates well with 20th-century instrumental meteorological data, with regression values between 0.4 and 0.6. Because the scPDSI method translates PDSI into more than six hundred grid points across modern Mexico, visualizing and engaging with the data usually takes a cartographic form with clearly defined temporal parameters. The MXDA website provides a year-by-year time-lapse animation or tools to produce either maps of specific time periods or tabular datasets.
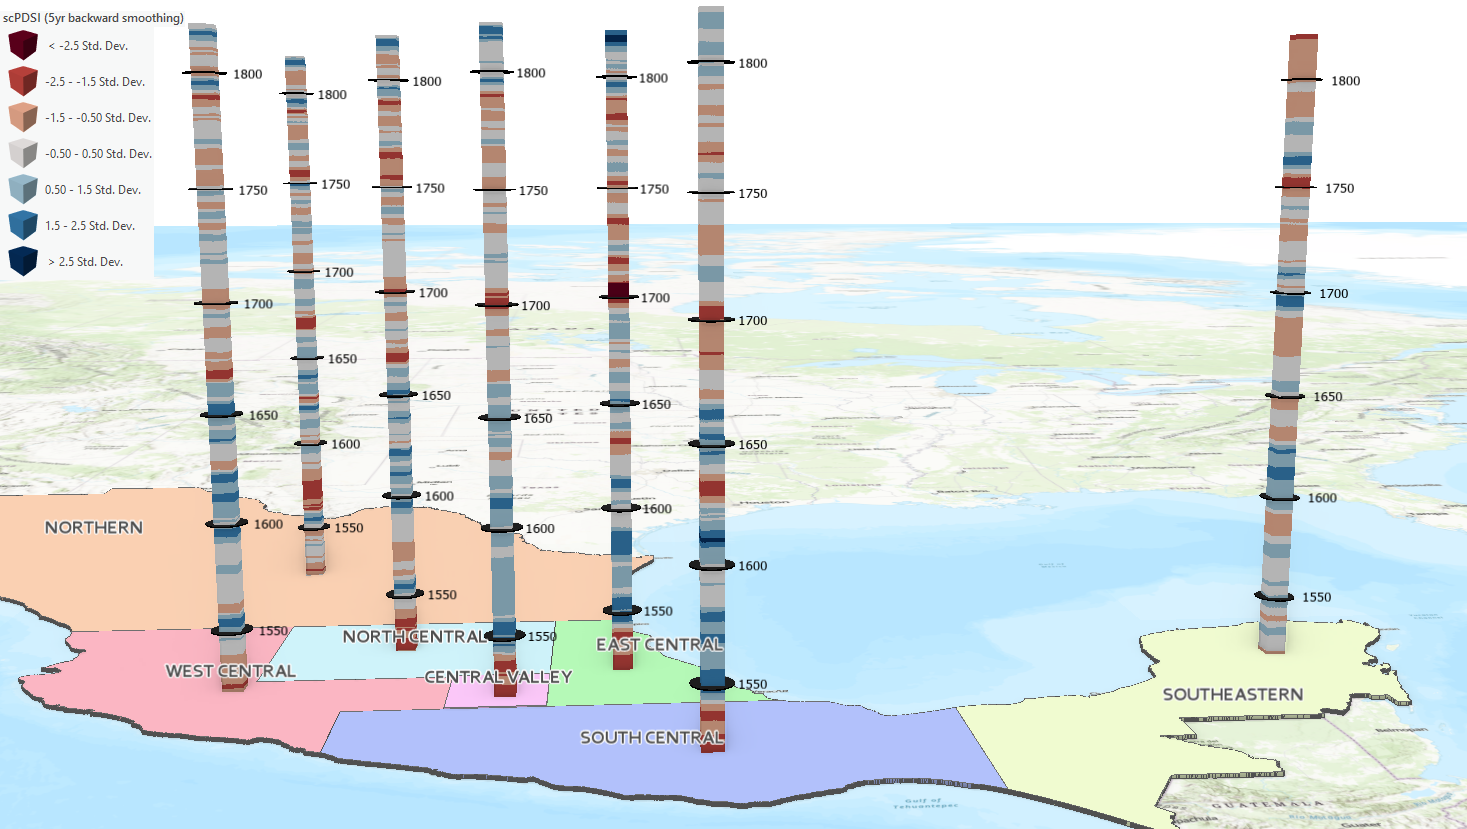
Aggregating the scPDSI into seven regions has illuminated the climatic trends across Mexico, especially given the different weather systems that dominate different parts of Mexico. The Caribbean and Pacific Coasts, for instance, are dominated by very different weather systems. Northern Mexico lies outside of the tropical zone, meaning that it is less impacted by variance in the migration of the Intertropical Convergence Zone, a critical weather system that is responsible for much of central Mexico's inter-annual precipitation variability. The Yucatan peninsula has the poorest dendrochronological record and also differs substantially from central Mexican climatic patterns.
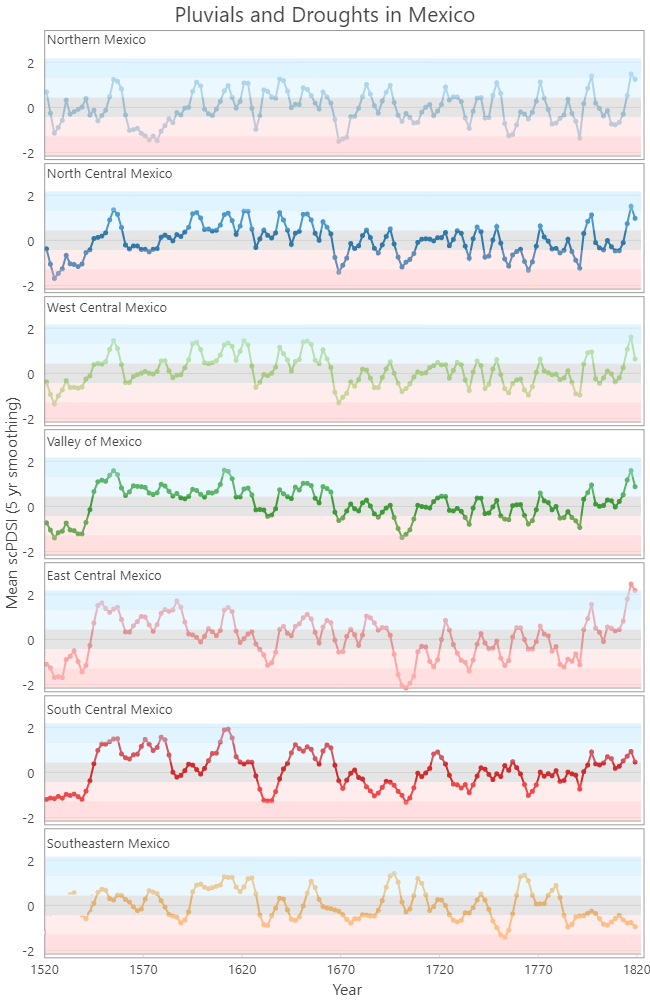
These differences can be visualized as a collection of time-series charts, each representing the climate of one of the seven regions between 1520 and 1820. The charts are organized from northern Mexico to central Mexico, and then to southern and southeastern Mexico. The charts provide some horizontal guides that show normal conditions in grey, anomalous wet phases and extreme wet phases in light and dark blue, respectively, and anomalous dry phases and extreme dry phases in light and dark red, respectively. It is difficult to determine any period where all seven regions share the same climate. Rather, the graphs indicate some inter-regional trends, specifically that the central Valley shares a climate with east central Mexico, and sometimes with west central and south central Mexico. Similarly, the northern and southeastern regions share almost nothing with each other and very little with central Mexico.
It is helpful to see this data in cartographic form, here in a 3D format where the regional time series can be compared horizontally rather than vertically. The map employs a similar color scheme to the indexed scPDSI values, from dark red (extreme drought) to dark blue (extreme wetness), with light grey indicating normal conditions.
Relating SES and PDSI
In order to compare the SES records with scPDSI, the SES data was first filtered for climate, agricultural, and social (CAS) categories, thereby removing the epidemiological and 'other' categories, a method that sought to analyze only the explanatory factors and to leave aside the dependent ones, while also focusing only on factors related to population regeneration rather than those disease outbreaks. Then, I computed the nearest scPDSI grid point to each geographic site in the SES database and marked the annually-resolved PDSI records with a binary value that distinguished scPDSI records that were nearest neighbors of a CAS-SES event of that same year. Finally, statistics were calculated for periods (of roughly fifty years) and crises (of between 5 and 10 years), using the absolute scPDSI value so that the mean and median values would reflect distance from zero rather than a muddled combination of extreme lows and highs that might average each other out. Through the calculation of these statistics, care was taken to only include PDSI grid points that fell within a half-degree latitude/longitude of a site that had reported at least once within fifty year periods. This created a shifting assemblage of valid PDSI points. The results are available on the statistics and data dictionary page.
As we interpret these results, we should keep in mind that the PDSI values for the periods and crises under consideration almost all correspond to extreme climate periods that are considered some of the most severe decades in the last two thousand years. Thus, it would not be surprising if the general regional climate was just as severe as the climate at the reporting CAS-SES sites. Nevertheless, we find that in only one crisis (1643-52) did general conditions match or exceed local ones. This case represents one of the worst general crises in the history of Mexico, second to only the 1785-96 crisis. In every other case, local conditions of reporting CAS-SES sites were worse and often substantially worse than the regional climate. Indeed, this is true for even some of the 40- to 70-year periods. For the entire 70-year period between 1750 and 1820, local conditions were 17% worse than regional conditions. As we know, the vast majority of those SES events occurred after 1770.
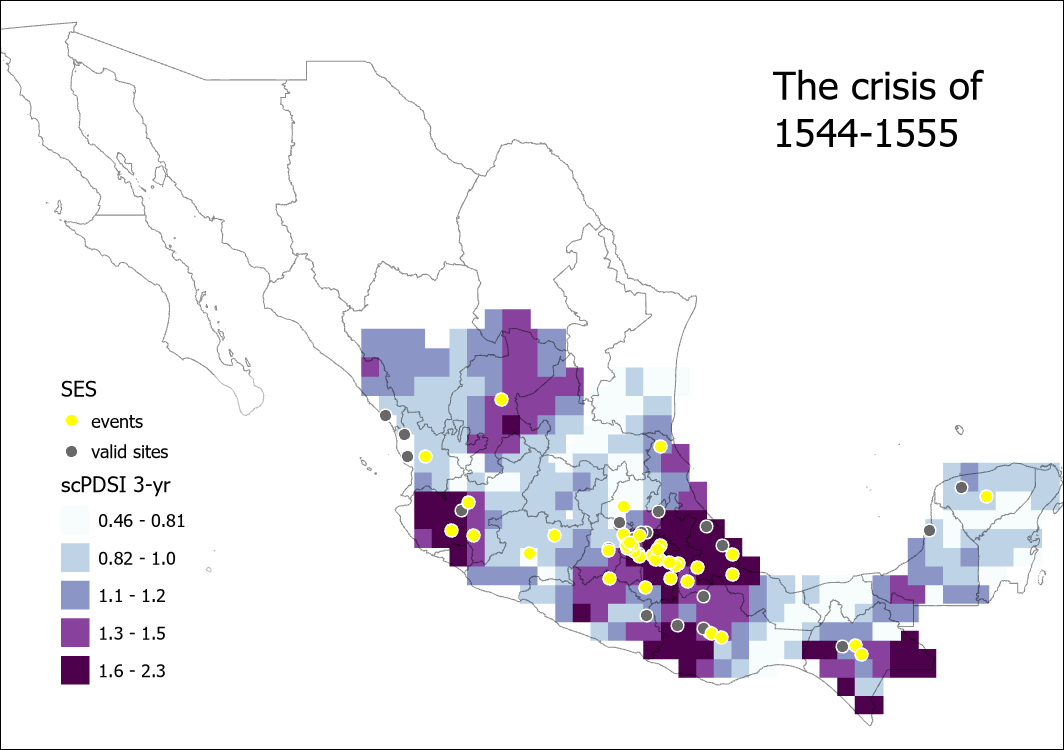
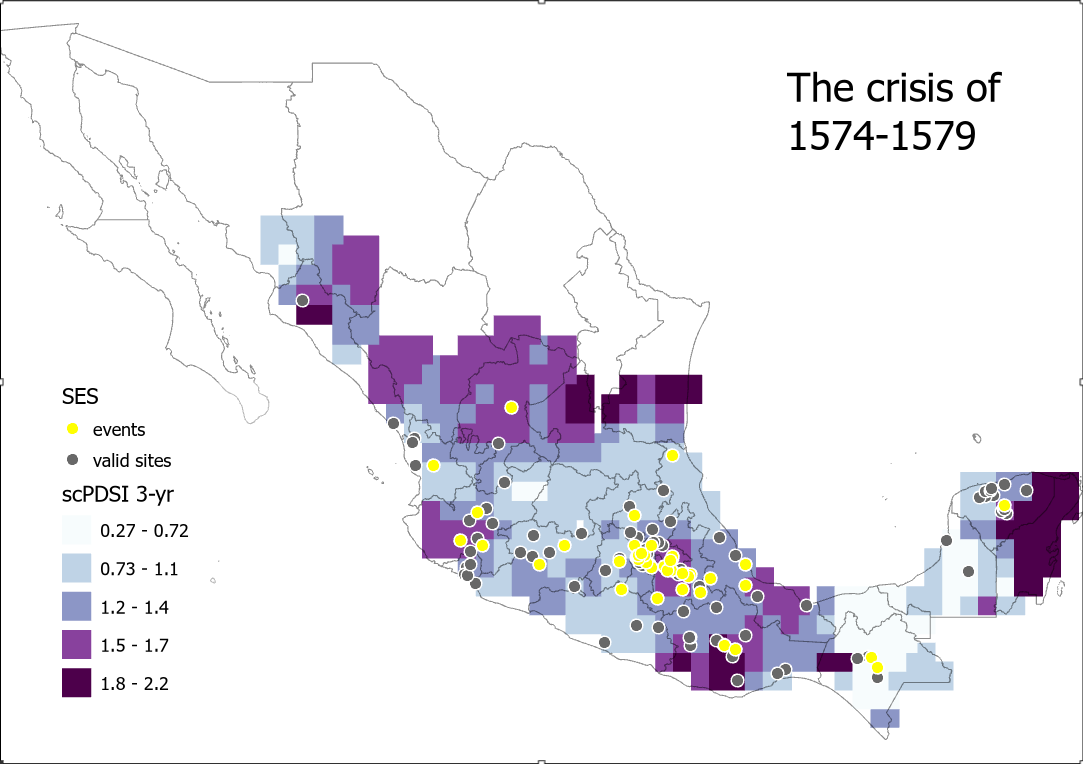
Some of the crisis events associated with the greatest mass mortality were those with both the highest PDSI values as well as the greatest divergence between local and regional values. The 1545 epidemic arrived at a dire time, climatically speaking, as did the 1576 epidemic, the 1692 epidemic, and the 1785/86 year of hunger. Only the 1737/38 matlazahuatl epidemic lacks a severe climatic context. Below we see maps showing the climatic contexts of the sixteenth-century crises. Sites that reported during the crisis are shown in yellow while sites that did not report during the crisis but which reported another time during the period in which the crisis fell are shown in dark grey.
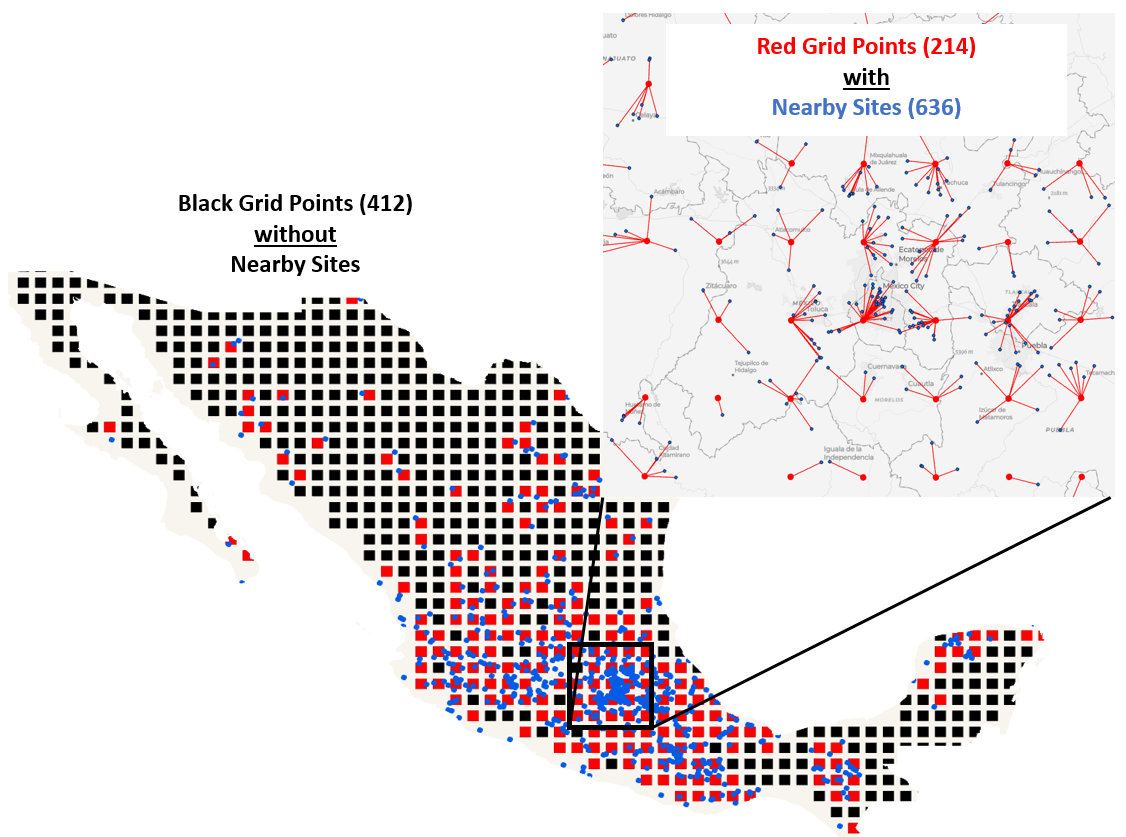
It is worthwhile pointing out that the methods employed in this study have sought to eliminate the effect of event density on research results. The reporting of SES events was far more likely in densely populated population regions such as Valley of Mexico, the Tlaxcala-Puebla Valley, the Oaxacan Valley, and central Michoacan. Mexico City, for instance, reported more than 700 events over the course the colonial era. Indeed, because of this extreme concentration of events in just a few regions, the concurrence of extreme scPDSI near those sites with reports of SES events resulted in extremely high correlations. To avoid this, a simple binary value was used for each scPDSI grid point indicating the presence or absence of a nearest-neighbor site. The image below shows the inequitable distribution of sites.
As it turns out, however, PDSI values for these high population regions appear to have been more severe and more frequently severe than in many of the less populated regions. The valleys of Mexico, Tlaxcala/Puebla, and even Oaxaca were some of the hardest hit regions in the 1540s, 1570s, and 1690s. The 1780s was a generalized crisis, but it was particularly brutal in the central Valley, as well as east, west and immediately north of it. Thus, while the binary method reduces the excessive dominance of these highly populated regions on the correlation of SES and PDSI, it also effaces the harsh reality of climate and health in those regions.
Climate & Demography
The analysis above has focused on specific crises and periods, demonstrating a close relationship between health (using CAS-SES events as a proxy) and climate (using scPDSI as a proxy). This analysis has overlooked the broad correlation between climate and population regeneration. We begin with the broad climatic trend in Mexico, which has a global resonance. The roughly 125-year period before 1670 was marked by unparalleled cold and excessive dampness. Such weather dominated central Mexico, leaving only a few intermittent decades as less severe. Afterwards, the weather turned drier, warmer, and generally more temperate. There were, of course, periods of devastatingly severe weather that interrupted the fair weather of the second half of the colonial era. The 1690s, for instance, was one of the worst crises in Mexican history. The 1780s also produced awful weather with terrifying famine and mortality. The Tambora crisis of 1815/16 interrupted the Mexican War of Independence and left high rates of mortality in its wake. And yet these were generally short-lived anomalies that reminded Mexicans of the fragility of life, especially in a population that was growing faster than almost every other nation in the world, except China. The climatic SNAFU that dominated Mexico during an era of cultural and political revolution, with the onset and imposition of Spanish imperial rule, was surely an unprecedented drag on population and fertility.
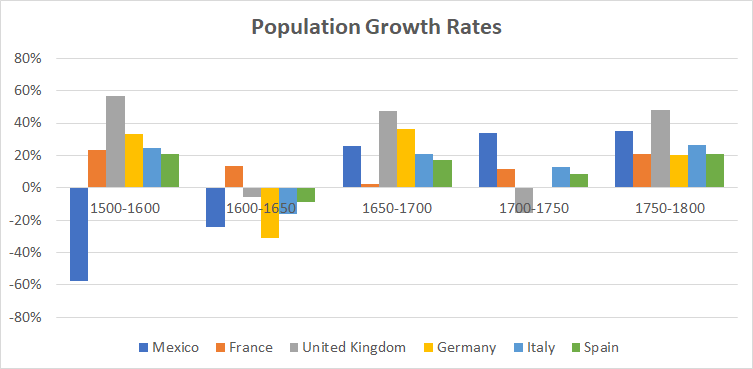
As the generalized climatic crisis waned after the 1660s, Mexico's population recorded an unprecedented resurgence. According to Our World in Data, demographic growth in Mexico during the second half of the colonial era outperformed nearly every other world region, except China. Between 1650 and 1800, the Mexican population rose by 127% while in France, the United Kingdom, Germany, Italy, Spain and Portugal, the average was growth rate was just 57% over the same period. The highest performer in Europe was the UK (85%). China's growth of 136% during that period has been depicted as a ticking population bomb by some historians [Brooke] and yet is not much higher than Mexico's. Actual growth rates in Mexico are much higher when the chronology is refined beyond the dates of 1650 and 1800, which are statistical conveniences that enable comparisons from one region to another. Both Challú and Abad & van Zanden, despite using very different datasets and methods of analysis, demonstrate the strongest rates of growth in Mexico occurred during the period from 1670 to 1770, with two major set backs in the 1690s and 1730s.
These high growth rates in the second half of the colonial era are also sustained by the work of historical geographer Peter Gerhard, who estimated a 100% growth rate over this period for Mexico's indigenous population and twice that amount for indigenous and non-indigenous combined. A region-by-region assessment of Gerhard's data (focusing on well-documented regions with large indigenous populations at the time of conquest) suggests growth rates between 50% and 200% between 1650 and 1800 [see Gerhard's entries for Antiquera, Cholula, Malinalco, Nochistlan, Puebla, Teposcolula, Tlaxcala, and Tula]. The combined growth rate of those regions is 104%, not quite as high as Mexico as a whole, but still higher than the European territories mentioned above.
Conclusion
The goal of this paper has been to paint a broad statistical picture of climate's role in the depopulation (and suppressed population regeneration) of Mexico. There is certainly much more work to be done before making any definitive claims. Especially lacking at present is information about Mexico's demographic collapse and recovery. Data for individual towns and provinces is now available in the secondary literature and awaits incorporation into a large database. Other data can be gathered from new primary sources, especially from births and deaths as registered in parish records [for example, see the work of Claude Morin or that of Elsa Malvido]. Additionally, it is hoped that the SES dataset will become much more evenly distributed once the crowdsourcing application is made public and is advertised. Further and better analysis, perhaps by means of formal geostatistical methods, might also improve and even alter the results produced in this paper.
Despite this reticence and these caveats, the data analysis provided above sets the stage--I believe--for an important reckoning in the study of mortality in colonial Mexico. Mortality and stagnated population regeneration seem to have a strong climatic signature. This is to say, climate extremes coincided with nearly every major mortality event and seemed to plague both soil and human fertility alike. If the arguments of Abad and van Zanden are correct, Mexico's road to recovery would have been much faster and much more complete had the Little Ice Age not interceded. Clearly, the lack of acquired immunity was a critical factor in the outbreak of epidemics, and clearly imperial policies made things much worse in certain places and times. Yet the general picture of rising real wages and GDP, along with the general availability of land and the new opportunities to mix Old and New World crops in innovative arrangements, should have all contributed to a significantly higher standard of living during this period. They did not, I would argue, because of the millennial-scale climate event that made hunger a frequent and violent part of daily life.