MJ Website Review: The Northwestern California Genocide Project & Mapping Decline
Introduction
Mapping Decline is a project of Professor Colin Gordon.[1] His book Mapping Decline examines the causes and consequences of St. Louis's urban crisis. It traces the complicity of private real estate restrictions, local planning and zoning, and federal housing policies in the "white flight" of people and wealth from the central city. And it traces the inadequacy—and often sheer folly—of a generation of urban renewal, in which even programs and resources aimed at eradicating blight in the city ended up encouraging flight to the suburbs. The urban crisis, as this study of St. Louis makes clear, is not just a consequence of economic and demographic change; it is also the most profound political failure of our recent history. Mapping Decline is the first history of a modern American city to combine extensive local archival research with the latest geographic information system (GIS) digital mapping techniques. More than 75 full-color maps—rendered from census data, archival sources, case law, and local planning and property records—illustrate, in often stark and dramatic ways, the still-unfolding political history of our neglected cities.[2]
The Northwestern California Genocide Project (NCGP)
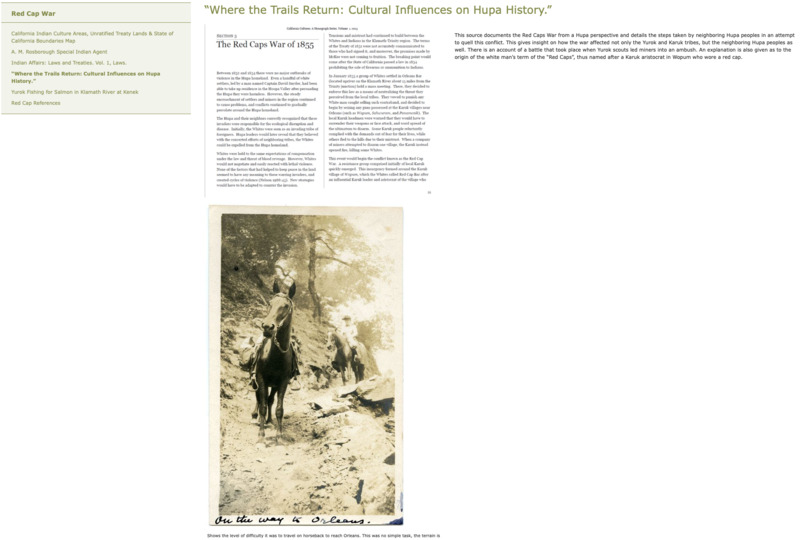
The Front Page
NCGP_Fig_1_Front
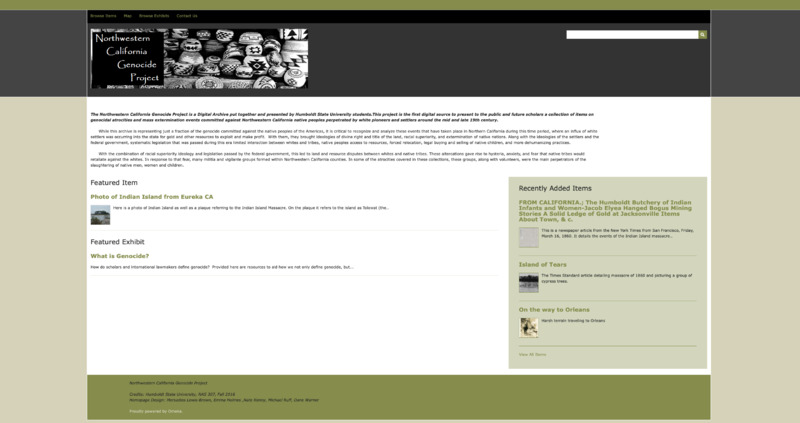
The front page of NCGP displays the category banner on top, its banner and search tab on top-mid, an explanatory note about the project on middle, and Featured Item-Exhibit, Recently Added Items at the bottom.
The position of the category banner is not intuitive though the search tab seems to be well fitted. The Featured Item and Exhibit sections disclose random circulation of contents from each category which provides good enough chances for users to have unexpected encounters.
Browse Items
NCGP_Fig_2_Browse_Items
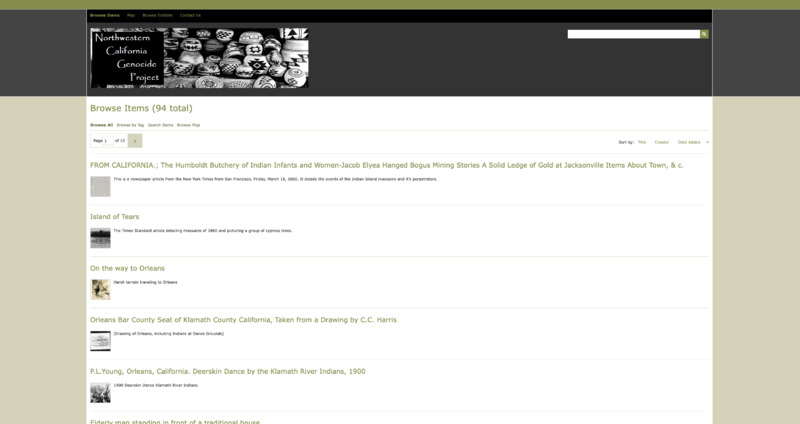
The Browse Items is a page with simple pile of archival sources. The page has a sort function by title, creator, and date added despite it does not really provides convenience for researching the information.
Map
NCGP_Fig_3_Map
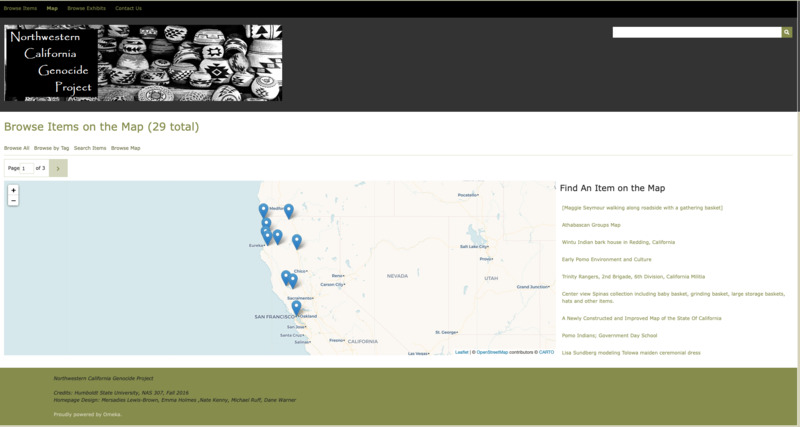
The second category is Map. The marked points on the map provide archival sources and information about the certain region. But there are three split sorts of the map lacking description about the causes for the division. It would have been better if the pages were intended to classify with themes, different timelines, or authors. Meaningless duplications of the pages merely caused distractions for the users to browse the items on the maps.
NCGP_Fig_3_Map_Items_1
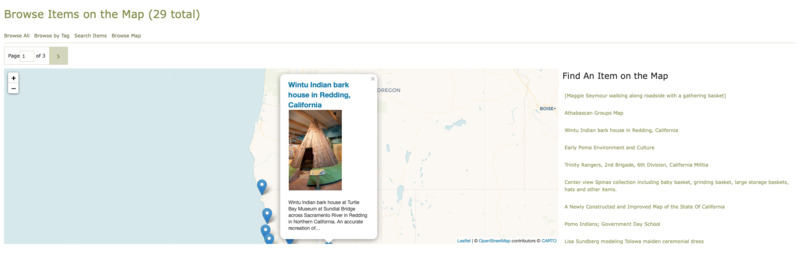
You can access to the brief information about the area with description and multimedia sources by clicking the spot on the map.
Browse Exhibits
NCGP_Fig_4_Browse_Exhibits_1
Browse Exhibits is a page with lengthy bulletins. The postings are dealing with the explanation about the Massacres with the items of the website.
Tag
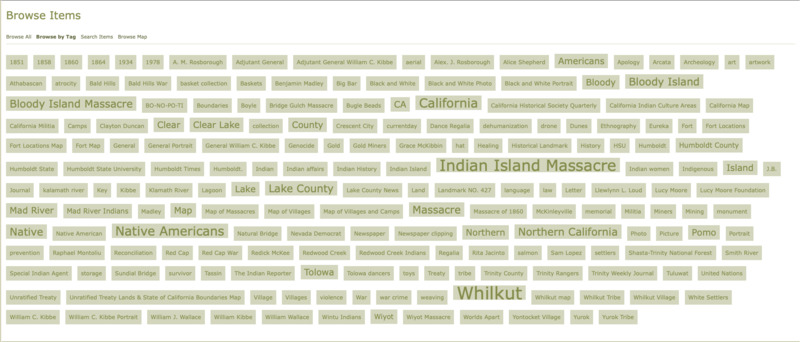
NCGP_Fig_5_Browse_Tag
One of the strong points in NCGP is the introduction of the tag. Dispersed items and pages could be organized with following the tag. However, some items and pages were not having any tags that could not fully utilize the function to provide convenience for the users.
Mapping Decline
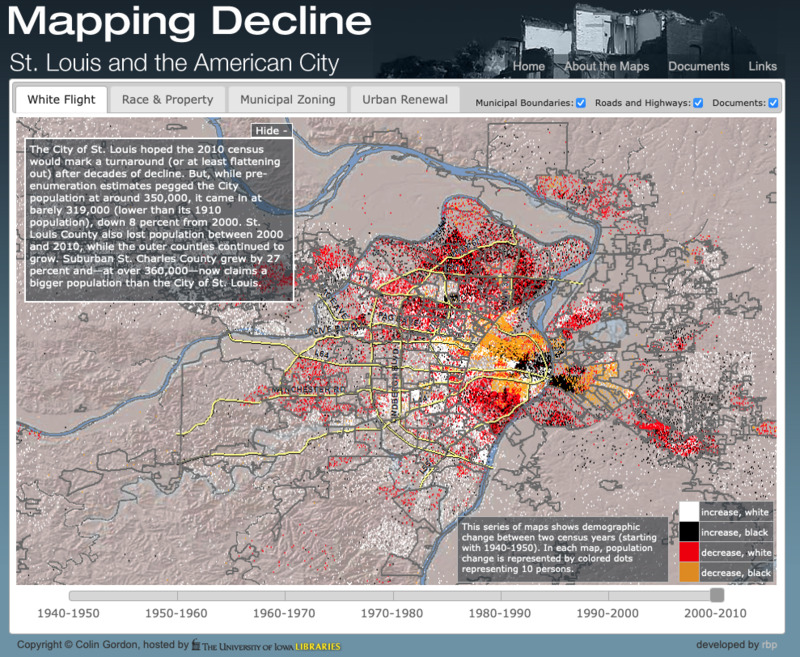
MV_WhiteFlight
The first tap of the Mapping Decline is "White Flight." By graphic expression marking with colored dots, Gordon successfully describes the chronology of suburbanization in St. Louis leaded by white people.
The density and progress directly drive the users to acknowledge the information spontaneously.
However, mixed-use of increase and decreese makes map a little bit congested that it would have been better to apply selective choice of displaying certain catecorgy of information.
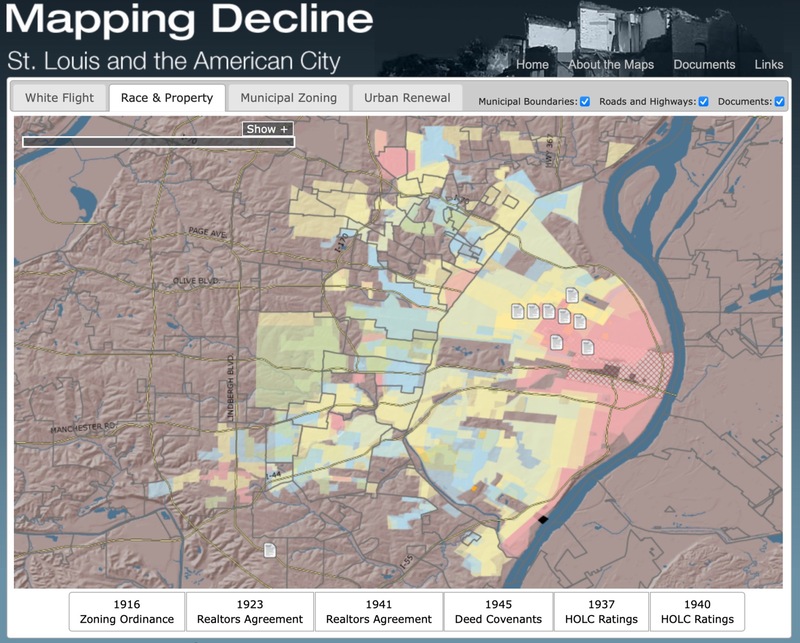
MV_RacenProperty
Race & Property tap dipicts the municipal policies and their effective areas. It is very instructive for users to identify the documented sources withe visual expressions. Moreover, Gordon attached the primary sources on map sothat the users can direclty access with.
Although, the icon of the documents is lacking visual distinctions or titles that makes it treacky to find out the information precisely.
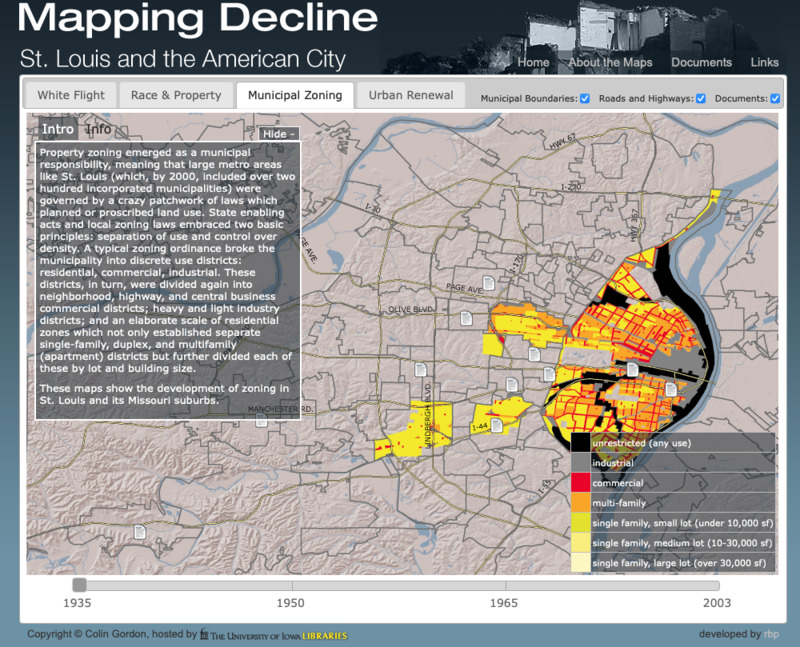
MV_Zoning
Municipal Zoning tap shows the development of zoning in St. Louis and its Missouri suburbs.
This tap has more attention at the explantive box. With Intro, he introduces the general meaning and historical context of his works. And Info discloses the detailed explanations about zoning with chronological order.
But a weakness in this tap is the choice of colors. It is intuitive to use saturated colors, despite for some people with color weaknesses would not recognize the zoning area since they were colored with red, orange, and yellow.
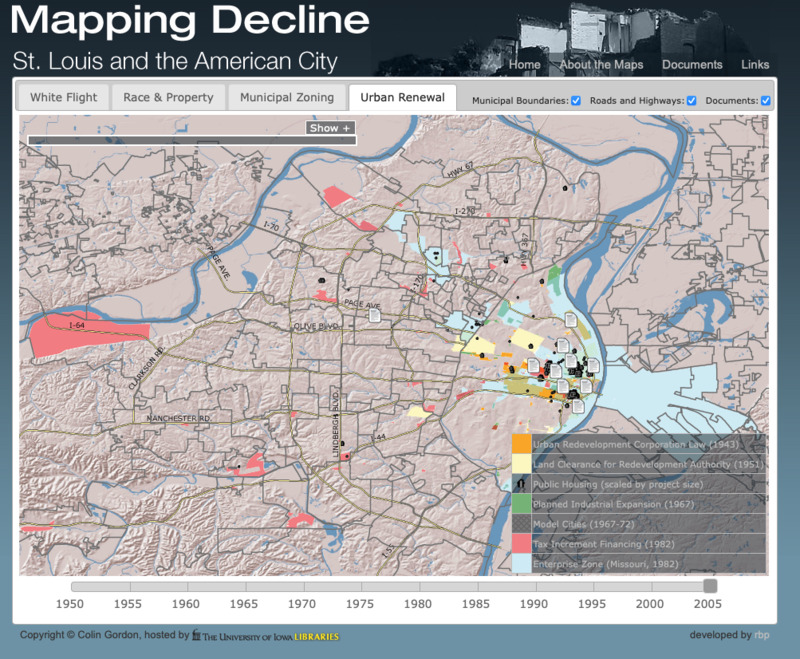
MV_UrbanRenew
Urban Renewal tap is to explain the expected side effect of redevelopment, public housing policies of federal-regional authorities. Gordon applied interactive index box to provide more descriptive explanations about each policies and plans.
It would have been better if he linterlocked the documents and indexings. Also, fixed scale of the map is not appropriate for the last categorization since it covers the most vast arial range.
General Assessment[4]
Professor Gordon added an instruction box to provide his intention and interpretation of the mapping data more accurately. And he applied minor adjustable factors like “municipal boundaries” and “roads and highways” information on map to correlate the geographical variables with the historical changes and policies as well. The minor details like the scale of the map and coloring were the only flaws in his work. Although, it would have been better if he applied a function such as a coalition of all mapping classifications. Providing more interactive features would benefit and pull the researchers.
Conclusion
The topic of both websites I diagnosed is closely related to our collaborative project. Among the branches of Digital Humanities, NCGP was more likely to be a digital archive, meanwhile, Mapping Decline was a graphical realization of spatial history. The latter is much more compatible with our collaborative project since it dealt with historical analysis of political dynamics of urban redevelopment. Despite it is lacking humane touch, because Gordon did not examine the cultural-life histories of victims of urban redevelopments. As our project is also focusing on private sector of the urbanite history in Sur, archiving and disclosing of the oral history, memoir should be included as well. Thus, NCGP’s format would be our result at the end as it used the same tool (we are using newest version but still), despite we should apply more fixed and organized style or structure.