HistoryForge
HistoryForge is a local digital history project started in 2016 by the History Center in Ithaca, NY (The History Center). The project utilizes census records, historical maps, city directories, and historical photographs to visualize the history of the city of Ithaca, NY, and more recently has branched out to Auburn and Elmira, as well. Records of houses and buildings are added to their database and then mapped on their site. They also use MapWarper, an open source mapping software, to georectify their historical maps (MapWarper). Records from their database are attached to each point on the map detailing the building’s historical information taken from the historical maps and local records, residents’ information taken from census records and city directories, and, where possible, historical photographs of the buildings.
All of the data entered into “The Forge” lives in their master database, and the project makes all of this data searchable by person or address to find the associated records. They even make their data available to download in CSV format so anyone can benefit from all of the work the project has done in transcribing their data. HistoryForge is impressive in its offering of all of this data to the public, both as downloadable spreadsheets and as embedded databases and maps on their site with which visitors can interact.
Site Design
The actual structure of the project’s site is a bit clunky and confusing. The primary site, https://www.historyforge.net/, has the project’s description, links to the databases for each census year, contact and volunteer information, and a link to “The Forge”, which is where the interactive map lives; however, all of the data and the maps are only for Ithaca. In order to view the other cities included in the project, you have to replace “www” in the URL with the city’s name (https://elmira.historyforge.net/, https://auburn.historyforge.net/); they are not directly linked from the site. The “About” section also links out to a page based on Github for some reason, rather than living on the main project site ("About", HistoryForge). The project does offer many resources on their Github page, but it would be less confusing to simply link to that repository rather than split up the project between the main project site and their Github site.
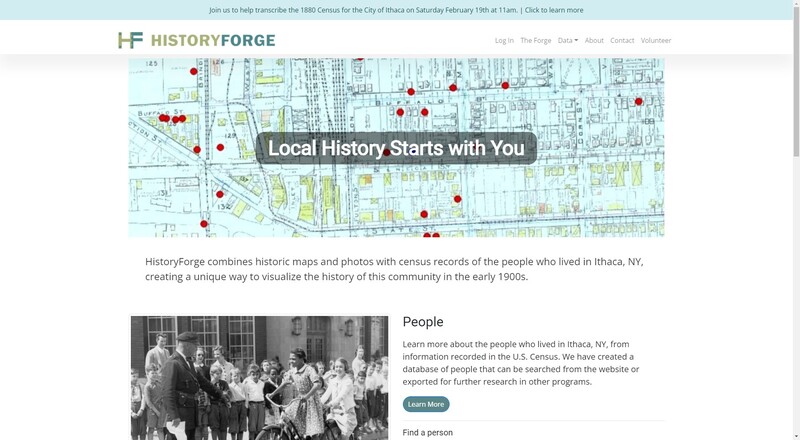
Despite these few shortcomings, the site itself is well designed and easy to navigate in order to interact with the project’s data and maps. The home page of the site clearly states its tagline, “Local History Starts with You” against the background of a historical map of Ithaca (replaced with maps of Elmira and Auburn for their pages respectively), and a clear and concise description of the project is prominent: “HistoryForge combines historic maps and photos with census records of the people who lived in Ithaca, NY, creating a unique way to visualize the history of this community in the early 1900s.” The home page does a great job of clearly representing the project within the first moments of opening the site.
The rest of the home page incorporates archival photographs with the two major ways the data is organized and can be searched: by person and by place. The bottom of the page details the funding of the project, primarily through grants through multiple benefactors, including the National Archives (NARA) and the South Central Regional Library Council (SCRLC). It also provides information on getting involved, bringing HistoryForge to new cities, and contact information for getting in touch. Though filled with a lot of information, the HistoryForge home page effectively and concisely communicates the project’s purpose, the site’s capabilities, background and contextual information on the project, and an invitation to join their efforts. Overall, the site is very well designed. It provides an easily navigable experience for the user, and the maps and their functions are very responsive, making the process of interacting with The Forge highly enjoyable.
Functionality
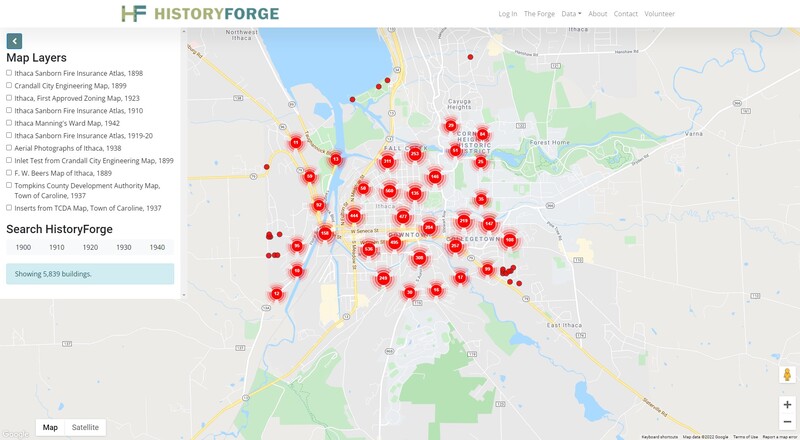
The Forge houses the interactive map and map layers for the represented years of the project ("The Forge", HistoryForge). For the Ithaca Forge, data is included from 1900-1940 and historical map overlays range from 1889-1942. The basemap is a standard GoogleMap with options to toggle between standard map and satellite views. The points on the map automatically aggregate depending on the zoom level in order to communicate an uncluttered view at any aspect. Clicking on a point on the map will bring up the record for that address, detailing the type of residence, construction if specified, and the families that resided in the buildings at years recorded. Each family consists of the members of the family and their household status (head or relation), ages, races, sexes, and occupations. Some records will also have historical photographs of the residents or buildings where applicable.
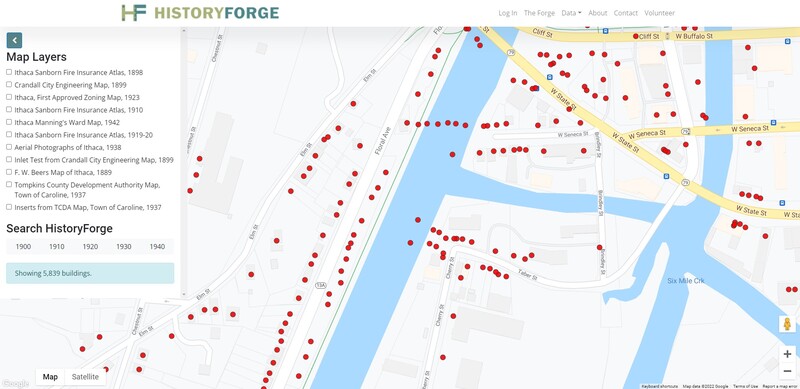
Selecting a map layer will automatically overlay a georectified historical map on the interactive map, and an opacity slider will become available so site visitors can customize their view of the data. The default view of the map shows all of the possible buildings, but choosing one of the years will narrow the points on the map to just the records from the year selected. This will also bring up a search bar and option to view the related census records. Their map is very impressive. Not only can you view the growth and changes of residences over time, but it is also a useful tool in observing the changes in geography and city infrastructure. Zooming in on one of the channels that feeds into Cayuga Lake, several points are visible in the middle of the present day channel.
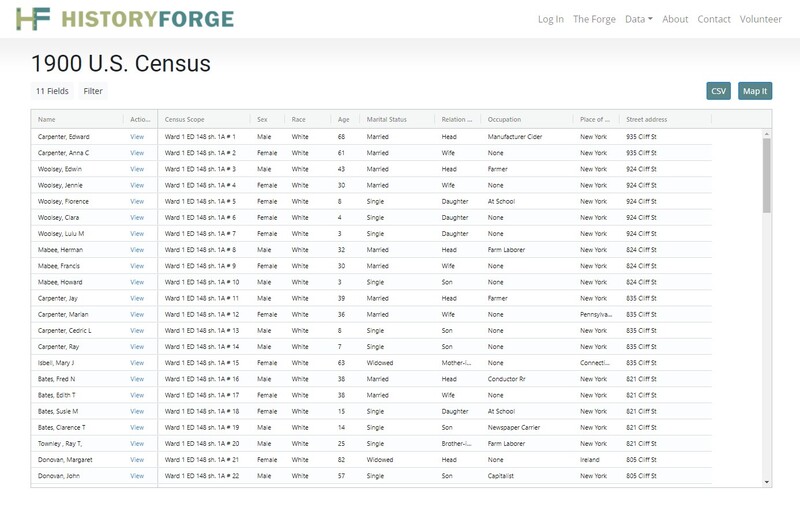
The Data section of the site is where visitors can interact with the database storing all of the building and resident data compiled from the census records, city directories, and historical maps consulted for the project (Buildings, 1900 Census, 1910 Census, 1920 Census, 1930 Census, 1940 Census). The database can be viewed in different sections: one for all of the buildings represented at one point or another in the project and one section for each census year. The census data pages can be easily filtered and searched by any of the parameters recorded in those census years. At the top right of the table, the CSV button will automatically download the data to your computer and the Map It button will take you to the corresponding view of The Forge.
An enormous amount of the transcription and data entry for the data represented in HistoryForge is collected through volunteer work and crowdsourcing. As they state on their home page, “Local History Starts with You,” HistoryForge is eager to have local communities become invested in their project – not just for help with the more labor-intensive tasks, but to encourage and invite local community members to take on an active role in documenting their community’s history. On The History Center’s site, they go into more detail about the process of volunteering with HistoryForge, which includes biweekly “Transcription Bees” where volunteers come together in a sort of working meeting to transcribe together (The History Center). More experienced transcribers are paired up with newer volunteers to create a sense of peer mentorship as they work on the project together. They even have a section on how to approach teaching HistoryForge to children with activity sets available to download. These activity sets include “scavenger hunts” with instructions for finding the information on HistoryForge as well as other history-focused activities.
Applications and Recommendations
An interactive map with different layers and customizable views like this one on the HistoryForge site would be a great addition to the Mapping Violence site. Allowing site visitors to choose their own experience and explore the various map layers and geographic changes over time in their own ways will provide a more memorable and rewarding experience. Similarly, the Mapping Violence map should have popups with contextual information for each point marked on the map, and especially any photographs that can best represent the event that occurred there and the topographic changes to the land. HistoryForge’s use of MapWarper is interesting and it may also prove to be helpful to our project. In addition to being an open source program in which users can georectify their own historical maps, there are also thousands of maps available for download, including some for Diyarbakır.
This structure of the database as seen on the Data page could be useful on the Mapping Violence site as a way to make certain points of data accessible to other scholars who could use this data to inform their own research. This concept of more openly and widely sharing cleaned and compiled data is prevalent in digital humanities, and for good reason. So many others can benefit from this data, saving themselves time in processing data they may not have the means or access to under normal circumstances, and allowing them to bring more attention and insight to a subject that needs to be amplified amidst larger efforts made to conceal and erase. Incorporating the user-centered approach to self-guided interaction with the site elements along with more narrative-based and guided components would be a highly effective design for the Mapping Violence site. Site visitors need to be able to explore and learn about the site’s content at the own pace and in their own direction, but they also should be shown the unfolding of events as they happened historically.
Bibliography
HistoryForge, accessed February 16, 2022, https://www.historyforge.net/.
“HistoryForge Ithaca”, The History Center in Tompkins County, accessed February 16, 2022, https://thehistorycenter.net/HistoryForge.
Waters, Tim. MapWarper, accessed February 16, 2022, https://mapwarper.net/.
