Introduction - Purpose
Mapping Prejudice is an ambitious project with an ambitious goal, and that is to improve equality today by learning about and participating in history. Born, in part, out of Dr. Kirsten Delegard’s public history work including The Historyapolis Project, the project evolved and expanded as new people lent their unique expertise. A sense of place and a feeling of connection to Minneapolis tied this group of scholars together. Their backgrounds in sociology and history may have helped lead them to notice that their city was among the most geographically and economically segregated cities in the country. Seeking to accomplish real and measurable good, the creators of the project asked whether historical factors could be found that would explain the city’s salient racial inequality. An answer came from Dr. Penny Petersen, a fellow scholar of Minnesota history. Petersen was studying racially restrictive covenants, a tool of segregation that many Northern communities utilized following the Great Migration of Southern African Americans to Northern cities.
The creators of Mapping Prejudice have examined and transcribed more than 15,000 residential records in and around Minneapolis, Minnesota in search of racial covenants. These rascally additions written into deeds specified that a certain property could only be sold to a white person. Over time, these covenants helped create a system of de facto segregation that kept black families out of white neighborhoods. To this day, the effects of this legal and extra-legal segregation is visible in the wealth and home-ownership gaps between white and black residents of the city.
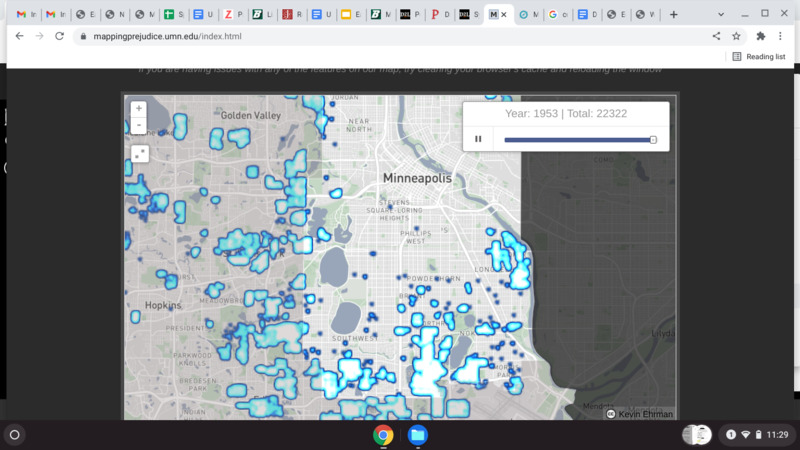
While restrictive covenants may be the meat and potatoes of the website, but the first word of its name is, of course, “mapping.” What makes this project “pop” is the moving map showing the growing area that became “off-limits” for African American families. For example, by the early 1950’s, there was a veritable ring of suburban neighborhoods, replete with homes with restrictive covenants surrounding the perpendicular borders of the city. We will discuss this further in the section on design, but it suffices to say the creators of the project bring history to animated life.
Website Review - Mapping Prejudice
Collaboration
Fitting perfectly into the model for a digital humanities project laid out in Anne Burdick’s 2012 book, Digital_Humanities, Mapping Prejudice is definitively collaborative. The project’s creators cooperated with each other, with other scholars, and with the public. Drawing on the talents of historians, geographers, digital humanities students, and others, the creators found a way to give history some teeth, and to share it with a wide audience.
The creators learned a great deal by communicating with members of the University of Washington’s Seattle Civil Rights and Labor History Project who had previously used digital tools to map the spread of restrictive covenants. The success of that program paved roads for the study of Minneapolis’ racially troubled past. Project creators also worked with the Mapping Inequality team from the University of Richmond, Va. These industrious individuals collected and made available to the public HOLC maps used to red-line black neighborhoods. The combination of these two tools, restrictive covenants and red-lined HOLC maps would directly influence the ability of African Americans to receive mortgage loans or home-repair loans. Over decades, this inevitably led to structurally worn and deteriorated housing stock. White bankers and real-estate salesmen then used that wear as proof that African American families abused their homes and were to blame for a lack of appreciating home values. With this highly pertinent history in mind, it seems only natural that Mapping Inequality should compliment Mapping Prejudice.
The ability to reach a large audience in a qualitative way expanded when the group began using Zooniverse to enable crowdsourcing. Individuals could help the project by looking at covenants that a computer flagged for words often associated with restrictive covenants. The computer could scan tremendous data, but it could not tell the difference between Mr. White selling his house, and Mr. Johnson only selling his house to a white person. A human needed to look at the deed and see why the computer flagged it and whether it contained a restrictive covenant.
Design
The design of the page is quite easy to navigate. Along the top are a number of tabs that connect the reader to information about the project and its construction. Each of these pages have a story-map quality to them, Offering sidecars as the reader scrolls down through the available information. Photographs of the team meeting and working occupy the background, providing a feeling both personal and professional.
The home page is attractive and user friendly. Upon opening it, one sees the title and the tabs along the top and is able to scroll down past three links that will connect the reader to news, maps, or information about the extension project of Ramsey County. Farther down is the moving map, and below that are two very useful introductory tools; a textbox explaining what restrictive covenants are and a digitized image of a deed with the restrictive covenant highlighted.
Concerning the moving map, the moving map is excellent. It accomplishes something that is very challenging for many mapmakers. It effectively displays change over time. Overlaid atop a map of the city of Minneapolis, is a bright blue layer that looks heat-map-esque to me. Year by year, and over the course of each year, we are able to watch the growth of areas around the city that barred African American people. In the upper right of the screen is a time-clock (?), a meter showing the year that the map is currently displaying. By watching the map portray its changes, the reader is able to perceive patterns and trends in the locations of whole neighborhoods that enacted restrictive covenants.
Overlaying the past over the present presents us with a glimpse into a past whose future we are familiar with. For instance, restrictive covenants kept African Americans out of neighborhoods adjacent to the best and largest parks, essentially barring them from the best public spaces. This method allows a glimpse into the intersection of power and space. This could be used, as well, to show the way that power affected space in Diyarbakir.
Analysis of Mapping Prejudice and Recommendations for Mapping Violence.
I think that Mapping Prejudice is a successful project, and I base that statement on my judgment of how many people came into contact with it. Public History, after all, is based on getting our work out to a larger audience, and one move that I mentioned previously seems to me to have been a masterstroke. By joining Zooniverse crowd-sourcing platform, the project welcomed the time and effort donations of thousands of people.
This inclusion was valuable far beyond the hours donated by volunteers. What this type of crowd-sourcing does is it creates new stakeholders, people who are interested in seeing a project succeed. By involving strangers and by getting them to give time, money, or energy, especially to a worthy cause, you are getting them to feel that they are a part of your project and that your project is a part of their lives. This “buy-in” will encourage continued participation and positive reviews when these volunteers speak to their networks of contacts. Additionally, as public historians, we succeed, in part, simply by getting more people to know about the history we are teaching.
In my opinion, a crowd-sourcing element to our Mapping Violence project could bring great benefit. Any person who spends ten minutes applying their focus to the situation in Diyarbakir is much more likely to be motivated to spend ten more minutes learning about how to help, or spending ten dollars on funding that help. If the people who join us are not from Turkey, then their inclusion will be a sign of our successful public history campaign. The collected opinions and written words of support could theoretically be collected and shared with residents of Sur, for the purpose of encouraging them and sharing support.
Voices of support, or even participation from within Sur, or Diyarbakir, or Turkey has the potential to benefit our project in other ways. Stories told from inside the walls, from inside the conflict zone could be used like a primary source to help build our “case”. Admittedly, I do not understand much about the conflict between the Turkish government and Kurds, and so my next point may be laughingly naive. Perhaps non-Kurdish Turks who would choose to become involved would become increasingly sympathetic to the cause of Diyarbakir and Turkish Kurds.
Another successfully implemented aspect of Mapping Prejudice that I already discussed and that I think could add significant value if transferred to our project is the moving map. Our friends from Mapping Violence showed us three maps of Sur showing a stark change caused by Turkish forces’ explosions and incursions into Sur. Perhaps more aerial photographs could be obtained (GPS?) that would provide a wider temporal context; photos from before and after the ones we saw, and perhaps more photos between those. Then, like in Mapping Prejudice’s map, ours would “move” through time, showing changes to our city of study. One option could also be to digitize the building outlines from the earlier maps, and show a layer of the destroyed buildings over a background layer of the flattened empty space.
Conclusion
A lot of smart people worked very hard to create Mapping Prejudice. They collaborated well and created a visually appealing, educational, and motivational project. Its purpose is to change the present by coming into deeper and more real contact with the past. As this review noted, I feel that there are a number of aspects of Mapping Prejudice that could benefit Mapping Violence greatly.
Works Cited:
Burdick, Anne, Et Al, Digital_Humanities. MIT University Press 2012
Mapping Prejudice. https://mappingprejudice.umn.edu/index.html